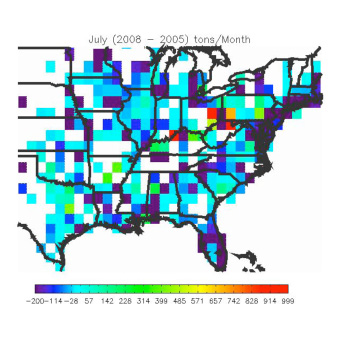
The Environmental Protection Agency's (EPA) nitrogen oxide (NOx ) Budget Trading Program along with State regulations and court orders have resulted in reduced NOx emissions from major point sources over much of the Eastern US as shown by Continuous Emission Monitoring System data (left: dark blue and purple squares show areas with reductions).
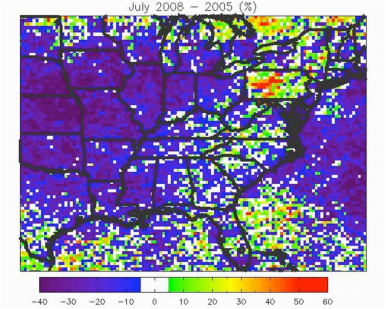
OMI tropospheric nitrogen dioxide (NO2) data from July 2005 and 2008 show large regions of the Midwest and Northeast Corridor with decreases of column NO2 of 20-40% as shown below (blue and purple).
However, Summer 2008 saw emission increases in Western Pennsylvania and other areas of the Ohio Valley under the trading program (red squares above).
Poorer air quality resulted over Pennsylvania (15-60% increases in column NO2 as shown by OMI on right). Ozone production was affected over East Coast metropolitan areas.
Differences in boreal fire emissions to the north and lightning to the south also contribute to the observed NO2 changes from OMI.
OMI Tropospheric NO2 Column Percentage Change
EPA Continuous Emissions Monitoring System NOx Data
10.2009

