 Evolution of the Hunga Tonga-Hunga Ha’pai sulfate aerosol and water vapor plumes
Measurements from the Aura Microwave Limb Sounder (MLS) revealed that a distinct aerosol and water vapor layer formed in the stratosphere.
 Earth’s ozone layer on track to recover within decades
Microwave Limb Sounder (MLS) data and scientists make key contributions to 2022 WMO Ozone Assessment.
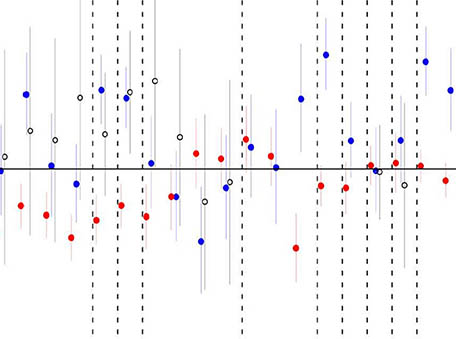
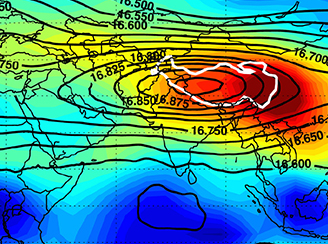
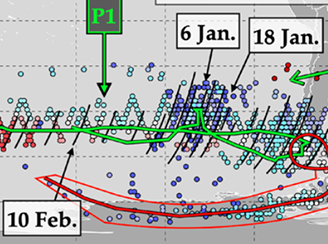
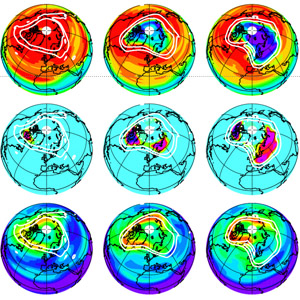
 Signatures of Anomalous Stratospheric Polar Vortex Transport
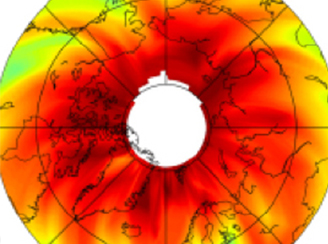
The 2019/2020 Arctic stratospheric polar vortex was exceptionally strong and long-lived, leading to the largest chemical ozone loss on record in the Arctic.
 The SPARC Water Vapor Assessment II
An assessment of satellite humidity measurements was undertaken by the SPARC project (Stratosphere-troposphere Processes and their role in Climate), which quantified the accuracy of H2O measured by spaceborne sensors including Aura's Microwave Limb Sounder (MLS).
 Upper stratospheric ClO and HOCl trends (2005–2020): Aura Microwave Limb Sounder and model results
This work examines trends in upper stratospheric chlorine species for 2005–2020, with an emphasis on chlorine monoxide (ClO) and hypochlorous acid (HOCl), measured by the Microwave Limb Sounder (MLS) on the Aura satellite.
 Hunga Tonga – Hunga Ha’apai Hydration of the Stratosphere
Measurements of the eruption of the Hunga Tonga – Hunga Ha’apai (HT-HH) underwater volcano from the Aura Microwave Limb Sounder (MLS) revealed that the eruption injected water vapor, SO2, and HCl into the stratosphere.
 Stratospheric Moistening After 2000
Aura Microwave Limb Sounder (MLS) measurements show substantial and persistent stratospheric moistening following a sharp drop in stratospheric water vapor.
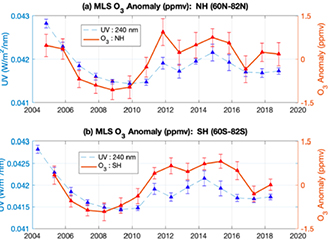
 Aura MLS and model simulations reveal a single-peak structure in the solar cycle signal in stratospheric ozone
Ozone profiles measured by the Aura Microwave Limb Sounder (MLS) over 16 years (2005–2020) were analyzed together with simulations from a 3D chemical transport model using different solar fluxes.
 Analysis of recent lower-stratospheric ozone trends in chemistry climate models
Analyses of monthly zonal mean merged satellite ozone observations that include Aura Microwave Limb Sounder (MLS) data as a major component have shown that lower stratospheric ozone over the 50ᵒS-50ᵒN region has been decreasing over the last two decades.
 Stratospheric Impacts of the Australian New Year’s Fires
The 2019/2020 Australian New Year’s wildfires (ANY) injected reco.
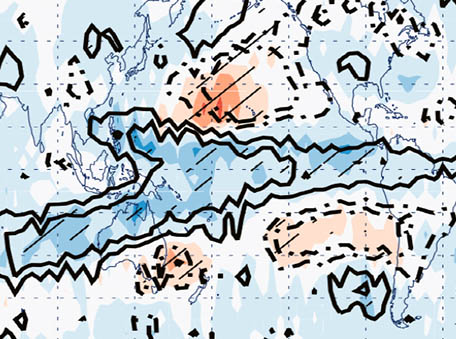 Using NASA Aura MLS and GMAO MERRA-2 data to resolve seasonal differences in lower stratospheric temperature, circulation, and composition due to the MJO
Long-term, high-quality Aura Microwave Limb Sounder (MLS) data enabled research that explains the strong seasonal and regional variations in climatically-important lower stratospheric (LS) trace gases (e.g., O3 and H2O) that are associated with the Madden-Julian Oscillation (MJO) – an eastward moving weather disturbance that traverses the tropics within 30 to 60 days, on average.
 How atmospheric chemistry and transport drive surface variability of nitrous oxide and trichlorofluoromethane
 Nitrous oxide is a greenhouse gas exhibiting long-term increases in its surface and atmospheric abundance, as a result of emissions from agricultural and industrial sources.
 Energetic particle precipitation and the quasi-biennial oscillation modulate Antarctic springtime chlorine partitioning and ozone loss
 Energetic particle precipitation (EPP) – the flux of charged solar particles into Earth’s upper atmosphere – can drive large nitrogen oxide enhancements.
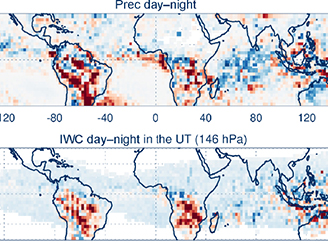
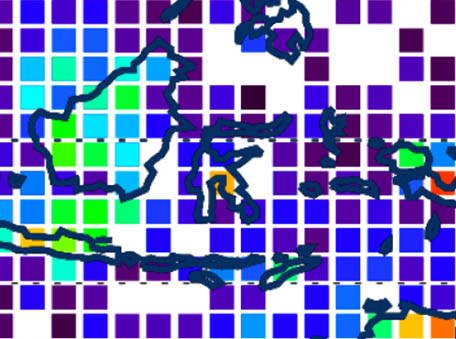 Ice injected into the tropical tropopause region by deep convection over the Maritime Continent
 Convective processes play a major role in controlling the abundances of cloud ice and water vapor in the tropical tropopause layer, which in turn strongly modulate climate. Despite their importance, these processes remain poorly represented in global climate models. Observations of the full diurnal cycle of cloud ice, closely linked to that of convection, are needed for model evaluation and refinement.
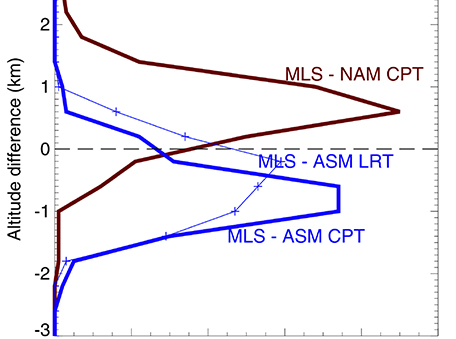
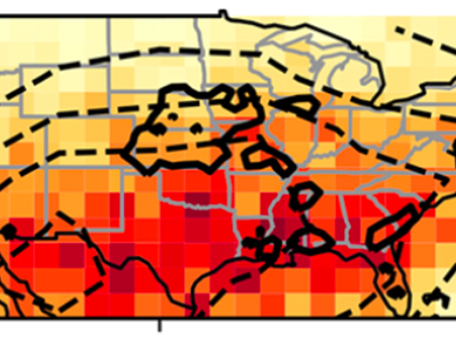 Influence of convection on stratospheric water vapor in the North American monsoon region
 Studies associate increases in stratospheric water vapor concentrations with considerable surface warming. This study indicates that convective moisture can be transported by the monsoon circulation and yield significant, large-scale water vapor enhancements.
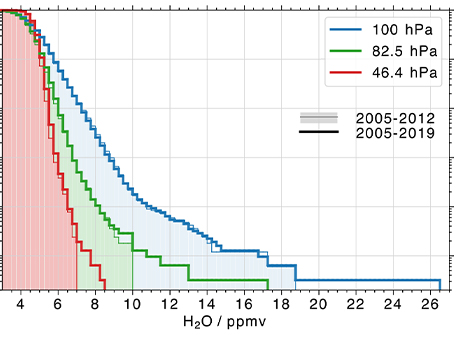 Extreme Outliers in Lower Stratospheric Water Vapor Over North America
 MLS Observations Show Relation to Overshooting Convection Diagnosed From Colocated Aqua-MODIS Data
 Seasonal stratospheric ozone trends over 2000-2018 derived from several merged data sets
 Studying the seasonal dependence of stratospheric ozone trends in the past decades helps to understand variations and trends in the ozone layer.
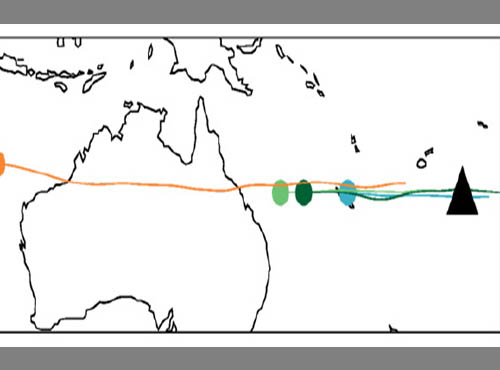
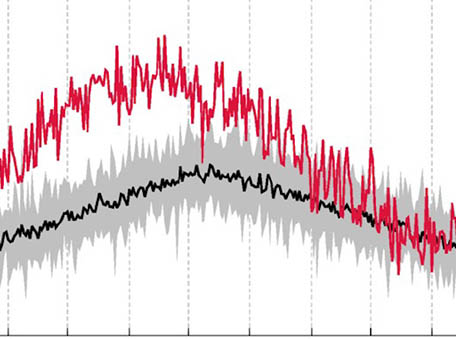
 Plume from Australian fires influences stratospheric composition
An extraordinary complex of Australian fire-driven pyrocumulonimbus (pyroCb) storms at the end of 2019 (the most recent and largest of three such events in the Aura Microwave Limb Sounder, MLS, record) produced an unprecedented stratospheric plume of fire emissions that circled the globe twice.
 Assessment of Observational Evidence for Direct Convective Hydration of the Lower Stratosphere
Understanding the processes that control stratospheric water vapor, as well as the causes of observed stratospheric humidity variations, is the focus of active scientific research.
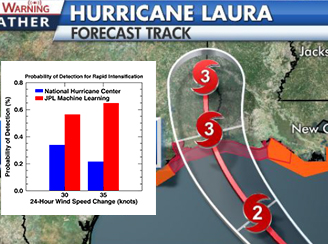 Improving Hurricane Forecasts with Machine Learning and NASA Satellite Data
In the US, hurricane damage comes at an annual cost of $24 billion, over half the cost of all natural disasters. The National Hurricane Center (NHC) has an impressive record predicting where hurricanes might make landfall. But less successful are predictions of so-called "rapid-intensification" of the strength of landfalling hurricanes.
 Transport From the Asian Summer Monsoon Anticyclone Over the Western Pacific
 The Western Pacific is an accessible location that provides rich opportunities for investigating the impact of the Asian summer monsoon on global upper troposphere / lower stratosphere composition, e.g., through aircraft-based research campaigns.
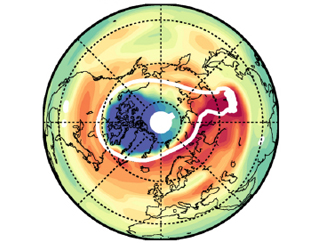
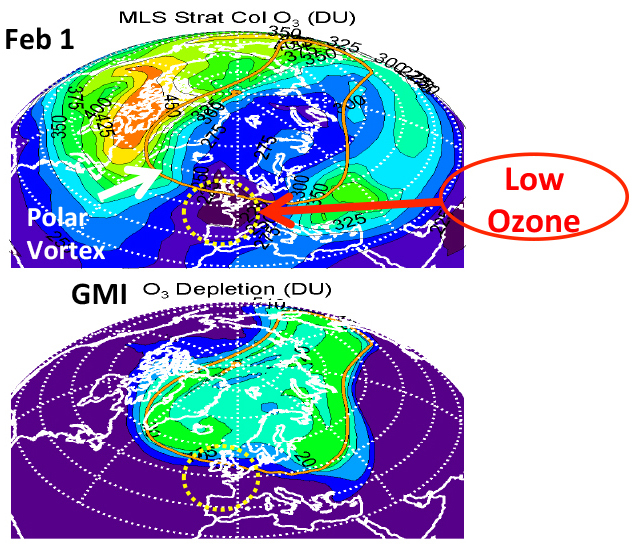
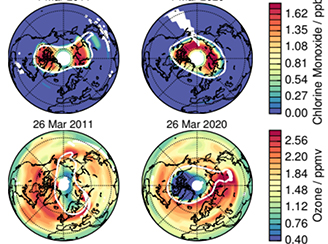 Aura MLS measures record-low levels of Arctic ozone
 Unusually prolonged cold stratospheric conditions in 2019/2020 have led to record-high chemical ozone loss and thus record-low ozone levels; only 2010/2011 came close. This behavior resembles that seen in the Antarctic, where an ozone "hole" recurs each winter.
 Plume from Australian fires influences stratospheric dynamics and composition
 An extraordinary complex of Australian fire-driven pyrocumulonimbus (pyroCb) storms at the end of 2019 produced an unprecedented stratospheric plume of fire emissions that circled the globe, rising from 15 to 31 km and persisting for more than two months.
 Solar Cycle Modulation of Nighttime Ozone Near the Mesopause
 What do long-term observations of ozone profiles from the Microwave Limb Sounder (MLS) aboard the Aura satellite tell us about the drivers of O3 variations near 90 km altitude (the secondary ozone maximum region), notably in relation to the 11-year solar cycle?
 Energetic particle precipitation and the quasi-biennial oscillation modulate Antarctic springtime stratospheric column Nitrogen Dioxide
 Aura Microwave Limb Sounder (MLS) measurements have previously shown that the easterly phase of the QBO is associated with increases in nitrogen in the Antarctic stratosphere.
 Impact of Convectively Lofted Ice on the Seasonal Cycle of Water Vapor in the Tropical Tropopause Layer
 Aura's MLS observes patterns of stratospheric humidity in the “Tropical Tropopause Layer” .
 Aura MLS measures record-low levels of Arctic ozone
Aura's MLS observations of Arctic vortex-average chlorine monoxide improve the understanding of stratospheric ozone trends and their uncertainties
 The Efficiency of transport into the stratosphere via the Asian and North American summer monsoon circulations
 This study confirms the important role of monsoon regions in moistening the lower stratosphere in boreal summer using data collected from Aura's Microwave Limb Sounder (MLS) .
 Vortex-wide detection of large polar stratospheric cloud particles in the Arctic winter stratosphere
Depletion of gas-phase nitric acid observed by Aura's Microwave Limb Sounder (MLS)
 Ice injected into the tropopause by deep convection
 Convective processes play a major role in controlling the abundances of cloud ice and water vapor in the tropical tropopause layer, which in turn strongly modulate climate.
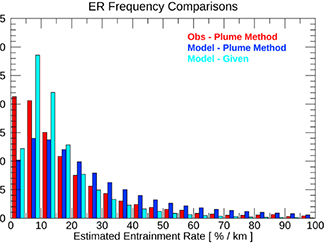 Convective entrainment rates estimated from Aura CO and CloudSat/CALIPSO observations
 Entrainment rate (λ) in convective parameterizations is one of the most sensitive, yet uncertain, parameters affecting climate sensitivity, clouds, precipitation, and trace gas distributions.
 Structural changes in the shallow and transition branch of the Brewer–Dobson circulation induced by El Niño
 The global meridional overturning of mass in the stratosphere, generally known as the Brewer-Dobson circulation (BDC), plays a crucial role in Earth’s climate system by controlling the distributions of atmospheric constituents.
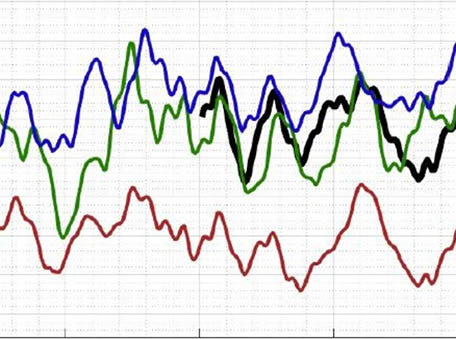
 Response of stratospheric water vapor and ozone to the unusual timing of El Niño and the Quasi-Biennial Oscillation disruption of 2015-2016
 Two major modes of climate variability that affect the stratospheric circulation, and consequently trace gas distributions, are the El Niño–Southern Oscillation (ENSO) and the Quasi-Biennial Oscillation (QBO).
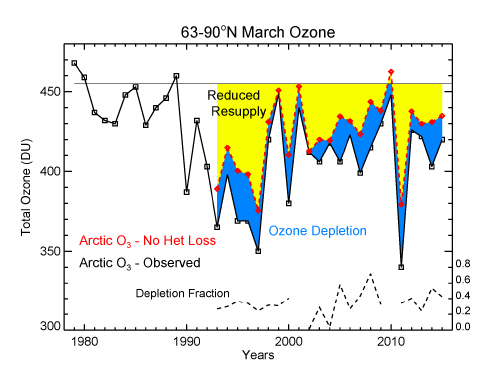
 On the role of heterogeneous chemistry in ozone depletion and recovery
 Conclusive verification that stratospheric ozone destruction is lessening as expected in response to international controls on anthropogenic ozone-depleting substances (ODSs) enacted under the Montreal Protocol is one of today’s atmospheric science imperatives, but robust detection of such ozone “recovery” is complicated by large natural variability.
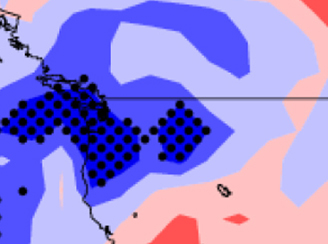 Effects of Arctic stratospheric ozone changes on precipitation in the northwestern United States
 Changes in stratospheric ozone can induce, via atmospheric radiation balance, stratospheric circulation anomalies.
 Evaluating models of stratospheric composition
 How well do a free-running and “nudged” chemistry climate model reproduce global timeseries of upper atmospheric composition (biases, variability, trends)?
 The Nature of Ozone in Deep Convective Clouds As Measured from Aura OMI/MLS
OMI satellite measurements reveal for the first time many key features of ozone variability inside deep convective clouds
 Trends in Global Tropospheric Ozone Inferred from a Composite Record of TOMS/OMI/MLS/OMPS Satellite Measurements and the MERRA-2 GMI Simulation
OMI satellite measurements identify increases in tropospheric ozone over Saudi Arabia/India/Southeast Asia and other global regions
 Examining Impact of Boreal Summer El Niño–Southern Oscillation Events on Tropical Lower Stratospheric Ozone : Using Aura MLS Ozone Observations
 The interannual variability of tropical lower stratosphere ozone and its connections to sea surface temperatures in the equatorial Pacific are examined using a combination of chemistry climate model simulations, satellite observations, and reanalyses.
 Multiple Aura Datasets Contribute to the Tropospheric Ozone Assessment Report (TOAR)
 In the troposphere, ozone is both a major pollutant and a strong greenhouse gas. Although spaceborne and ground-based observations largely agree on the overall tropospheric ozone loading, estimates of decadal-scale trends vary significantly between datasets.
 Quantifying Convective Hydration of the Stratosphere Using Aura Microwave Limb Sounder & CALIPSO Data
 Variations in stratospheric water vapor are known to have a significant impact on surface climate, yet the processes controlling the long-term evolution of stratospheric humidity remain incompletely understood.
 Using A-Train Polar Stratospheric Cloud Information to Validate Polar Stratospheric Reanalysis Temperatures
 Stratospheric polar processes, such as the potential for ozone loss via heterogeneous chemical reactions, depend critically on temperature. We have assessed the temperature biases of several modern meteorological reanalysis datasets.
 Detecting Impacts on Global Ozone
 How well can the impacts of changes in ozone depleting substances (ODSs) and greenhouse gases (GHGs) on global ozone (O3 ) be detected and distinguished? Aura Microwave Limb Sounder (MLS) Global O3 profiles are used to detect fingerprints of ODS & GHG impacts.
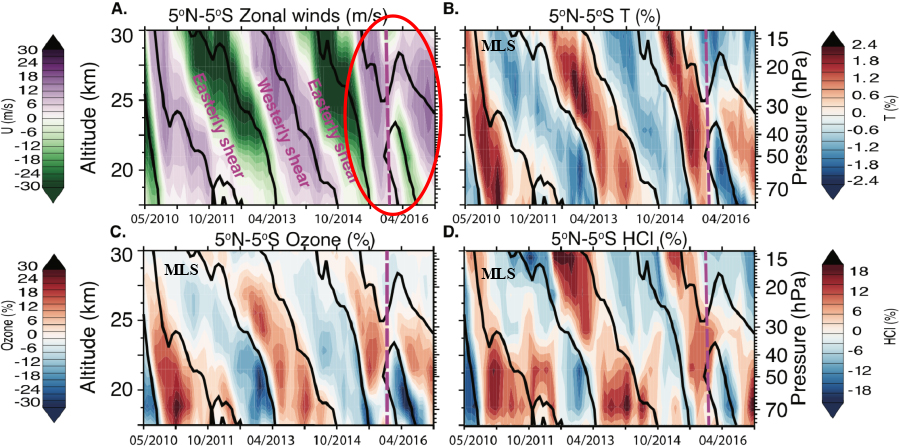 Unusual Variability in Tropical Measurements Linked to the Unprecedented 2015-16 Disruption of the Quasi-Biennial Oscillation
The quasi-biennial oscillation (QBO) consists of alternating easterly (east-to-west) and westerly (west-to-east) directions of the wind in the tropical stratosphere with an average period of 28 months.
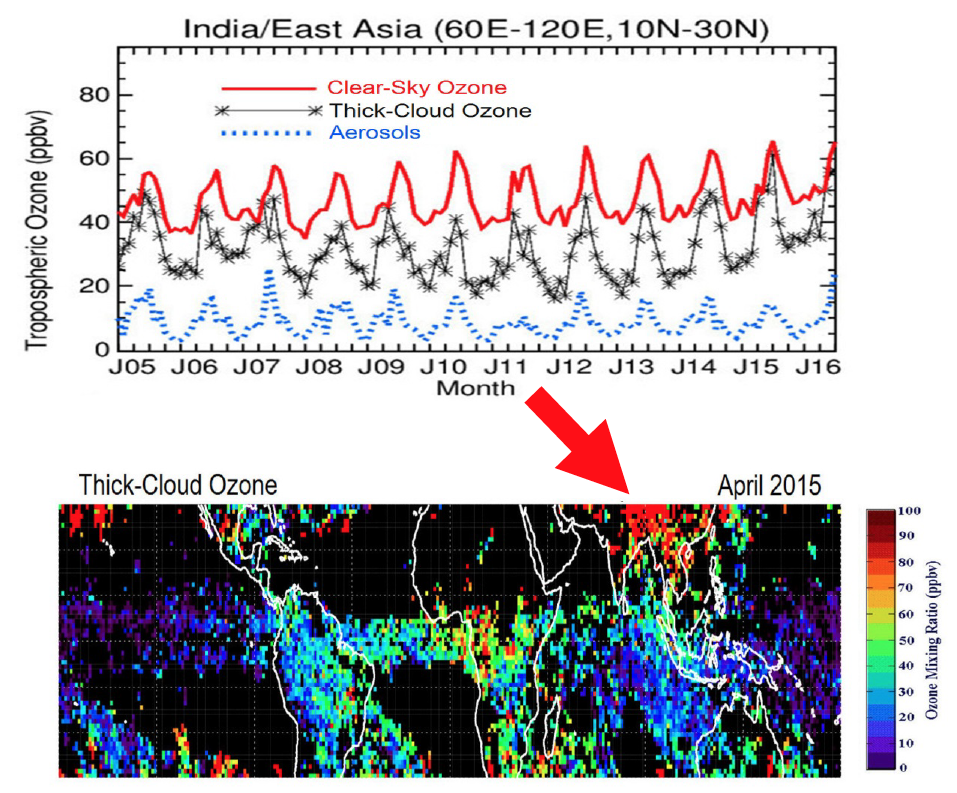 The Nature of Ozone in Deep Convective Clouds
 Ozone within deep convective clouds is controlled by several factors involving photochemical reactions and transport. Gas-phase photochemical reactions and heterogeneous surface chemical reactions involving ice, water particles, and aerosols inside the clouds all contribute to the distribution and net production and loss of ozone.
 N2O measurements are key to quantifying the photochemical and transport processes that affect Arctic spring ozone
The Arctic seasonal evolution of simulated O3 and the long lived trace gas N2O from the Global Modeling Initiative Chemistry and Transport Model (GMI CTM) both closely agree with MLS observations for all years since Aura's launch in 2004.
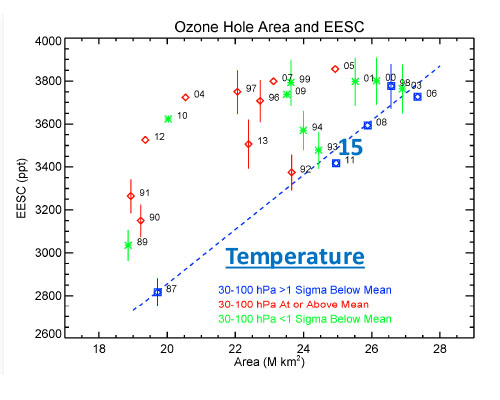 Large ozone holes will continue to occur in very cold Antarctic winters until 2040
The next three decades will see an end of the era of big ozone holes. In a new study, scientists from NASA Goddard Space Flight Center say that the ozone hole will be consistently smaller than 8 million square miles by the year 2040.
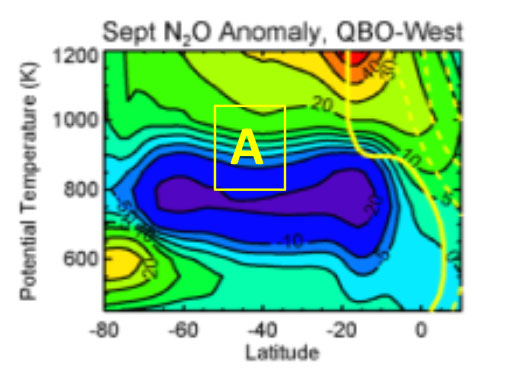
A decade of MLS Nitrous oxide reveals a remarkable transport pipeline from the midlatitude middle stratosphere to the Antarctic lower stratosphere, allowing tropical winds to modulate how much chlorine reaches the Antarctic ozone hole each year.
To quantitatively understand anthropogenic impacts to the stratospheric ozone layer, we must be able to distinguish between low ozone caused by ozone depleting substances and that caused by natural dynamical variability in the atmosphere.
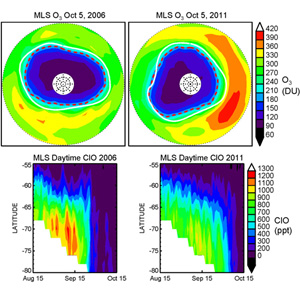
MLS ClO in the 2011 Antarctic vortex was 20% lower than 2006, yet the 2011 ozone hole is very similar to the 2006 hole, the largest ever observed.
Microwave Limb Sounder (MLS) observations quantify the changes in the hydroxyl radical (OH), hydrogen dioxide (HO2), and ozone due to Solar Proton Events (SPE)
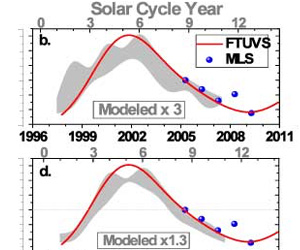
OH data from the Microwave Limb Sounder (MLS) on Aura and a ground-based FTUVS suggest a response of the OH column to the solar cycle that is significantly larger than model results using established solar forcing.
The Microwave Limb Sounder (MLS) on NASA's Aura shows weaker than usual ozone transport and strong photochemical loss
Unusually prolonged cold conditions in the spring 2011 Arctic stratosphere promoted levels of chlorine activation and chemical ozone loss never before observed in the Arctic, comparable to those in the Antarctic in some winters.
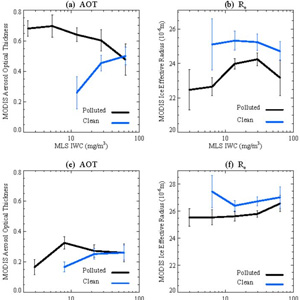
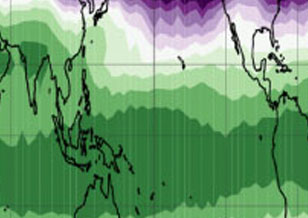
The properties of the polluted clouds indicate a warming and moistening effect on air entering the stratosphere by the pollutants in Asia.
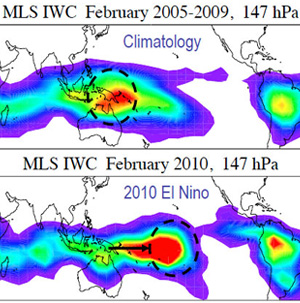
Aura MLS observations show clear imprint of 2010 El Niño in the upper troposphere
Prolonged low temperatures in September 2006 increased by the longevity of 'active chlorine', leading to a record area and depth of the ozone hole.
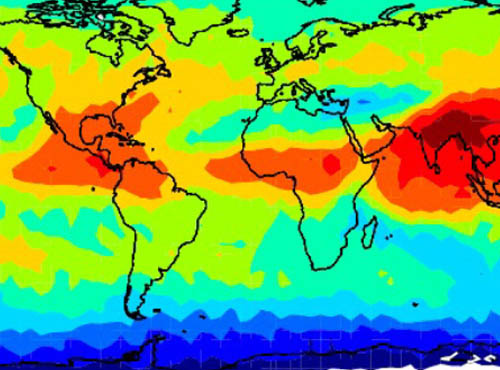
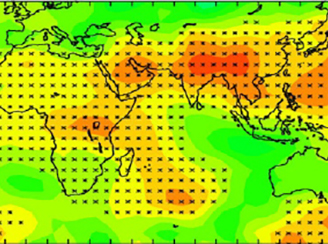
OMI & MLS can estimate the tropospheric ozone residual by subtracting the MLS stratospheric ozone from OMI column ozone. These maps show pollution streaming from the U.S., Europe and China to the west in summer and pollution from biomass burning in the equatorial zone.
Cloud ice measurement will improve global circulation models used for weather and climate forecasts.
The measurements will also help quantify the upper tropospheric hydrological cycle, including water vapor feedbacks on climate change.
MLS sees cloud ice, but HIRDLS sees the clouds themselves, even clouds that are so thin that people cannot see them. Just as in the MLS cloud ice map we see large amounts of this cirrus in regions of significant cloud ice.
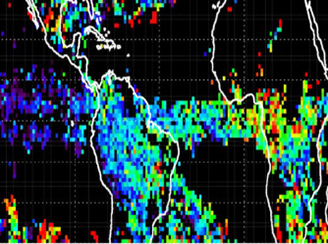
CO is a signature of pollution and can be transported a long way from its source. Not surprisingly, that transport can be vertical as well as horizontal. These images show how CO detected in the lower stratosphere can tell us something about where convection is occurring.
The continuous measurement of HCl in the stratosphere shows the rapid recovery of this major chlorine reservoir after polar ozone loss, and continues the long-term measurements from UARS HALOE. Monitoring HCl tells us about ozone loss processes and the recovery of the ozone layer.
The MLS measurements of OH and HO2 have provided the first tests of global stratospheric hydrogen chemistry and resolved the disagreement between model estimates of OH and earlier observations - these data suggest earlier observations are suspect.
As tropical air rises into the stratosphere it carries with it trace gases, such as CFC's that are responsible for ozone depletion.
An unprecedended suite of simultaneous measurements by MLS allows more accurate quantification of ozone destruction in the 2004-2005 Arctic winter.
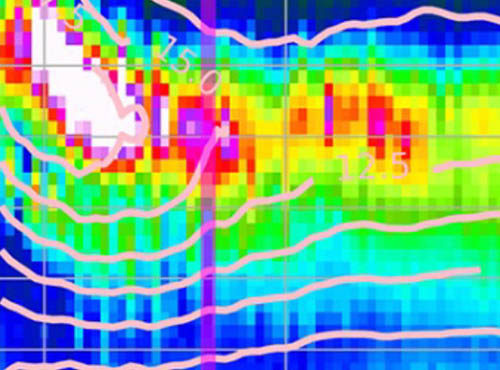
These images show MLS detection of enhanced SO2 and HCI in the lower stratosphere over New Guinea on January 28, following eruption of Manam volcano on January 27.
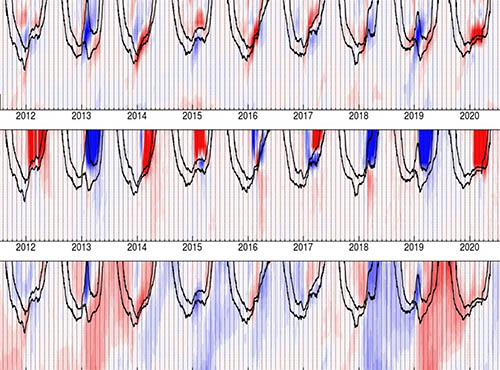
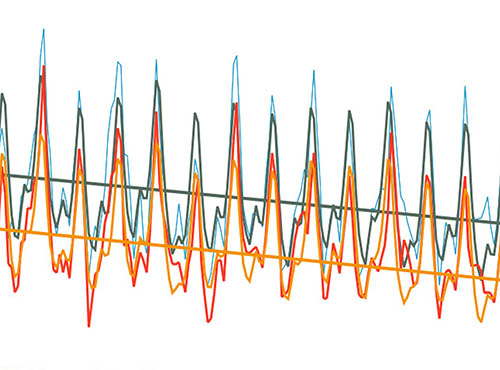
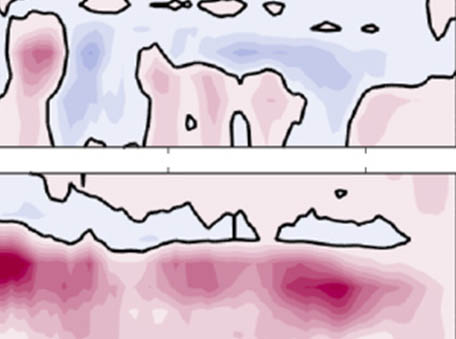
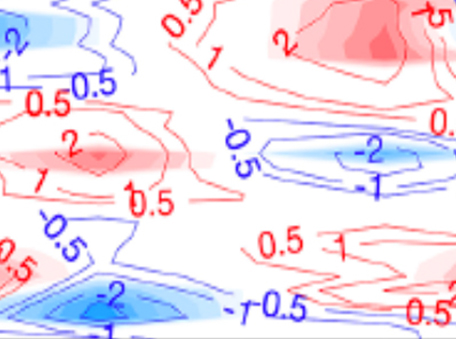
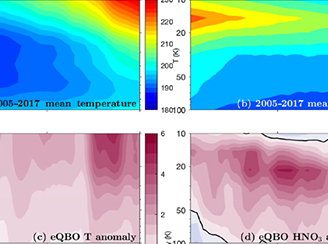
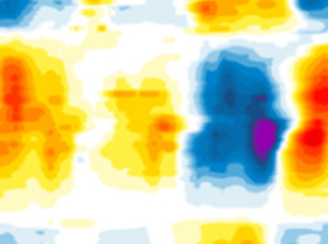
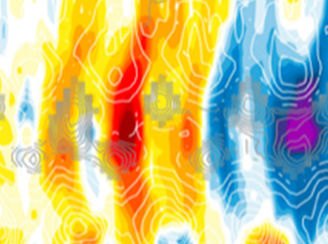
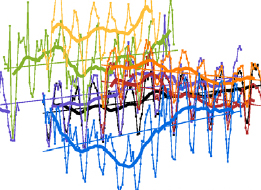
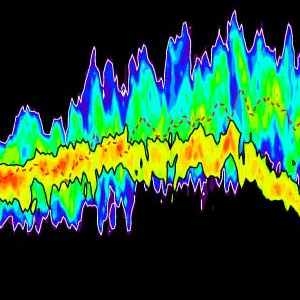
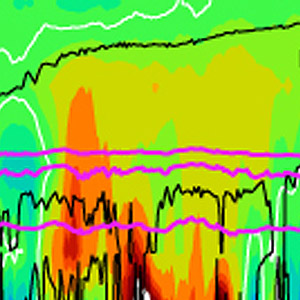
Time-pressure sections of zonally averaged water vapor mixing ratio, shown as the deviation from the time-mean profile.
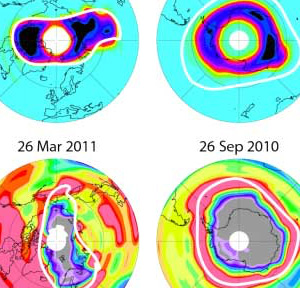
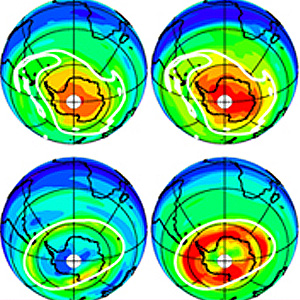
Maps of MLS HCI in the lower stratosphere (520 K, 20km) detailing the springtime breakup of the 2004 Antarctic vortex.
 Solar Proton Flare Affects Mesospheric OH and Ozone
Aura MLS has provided first observation of this connection

