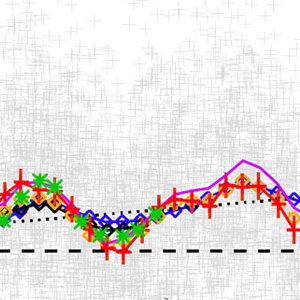
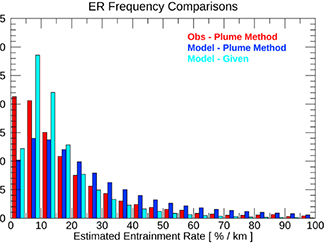
 Convective entrainment rates estimated from Aura CO and CloudSat/CALIPSO observations
 Entrainment rate in convective parameterizations is one of the most sensitive, yet uncertain, parameters affecting climate sensitivity, clouds, precipitation, and trace gas distributions.
 The 2018 National Academies' Decadal Survey Highlights Aura Data to Demonstrate the Power of Satellite Data for Science & Societal Benefit
 In "Thriving on Our Changing Planet: A Decadal Strategy for Earth Observation from Space" Aura data were presented as examples of satellite observations used as a global monitoring system for air quality & health and stratospheric ozone.
 Investigating peroxyacyl nitrate in North American biomass burning plumes : Using Aura Tropospheric Emission Spectrometer (TES) retrievals
 Peroxyacyl nitrate (PAN) is a critical atmospheric reservoir for nitrogen oxide radicals, and plays a lead role in their redistribution in the troposphere.
 Multiple Aura Datasets Contribute to the Tropospheric Ozone Assessment Report (TOAR)
 In the troposphere, ozone is both a major pollutant and a strong greenhouse gas. Although spaceborne and ground-based observations largely agree on the overall tropospheric ozone loading, estimates of decadal-scale trends vary significantly between datasets.
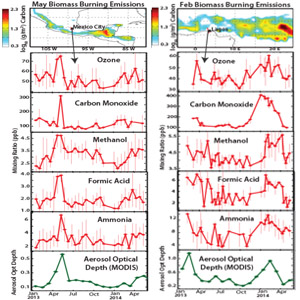
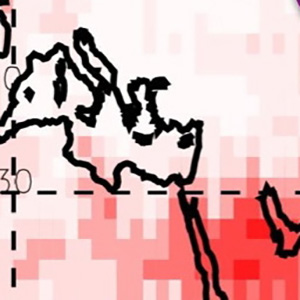
The suite of TES observations allows quantification of the impact of seasonal biomass burning pollution on the already poor air quality of the world's megacities.
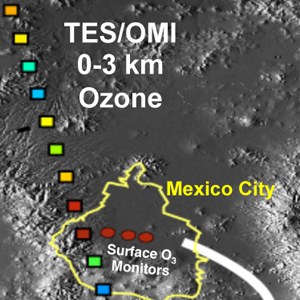
TES measurements of key chemical species allow us to examine not only air quality within the megacity, but also the regional and larger-scale implications of Mexico City pollution as it is transported out of the urban area.
Ammonia (NH3) pungently affects air quality. It is also involved in the formation of aerosol PM2.5 particles, which have adverse health effects, and impacts soil acidification, biodiversity, and the nitrogen cycle.
(Science Daily article)
A new NASA-led study uses TES data to find that when it comes to combating global warming caused by emissions of ozone-forming chemicals, location matters.
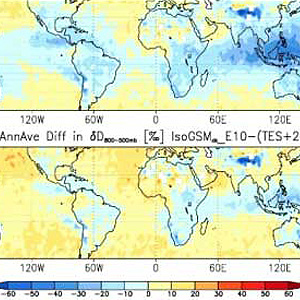
Differences between TES data and climate models are due to rainfall, evaporation and mixing processes....
04.2011 - TES measurements provide constraints on carbon dioxide (CO2) emission and uptake and methane (CH4) emissions.
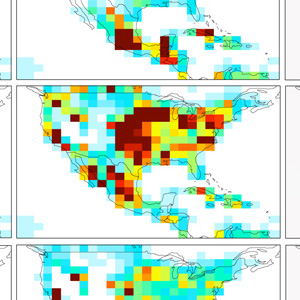
04.2011 - Stable isotopes from TES is used to constrain convective parameterization in a climate model.
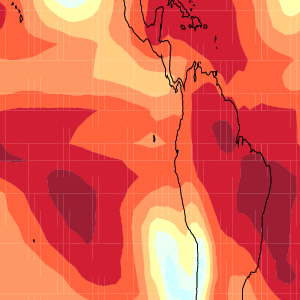
04.2011 - This map shows the longwave radiative effect of infrared radiation absorbed by tropospheric ozone as estimated from TES top-of- atmosphere observations.
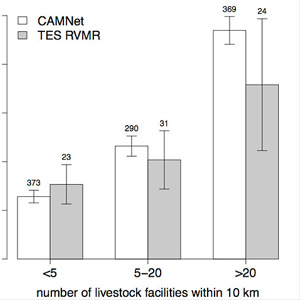
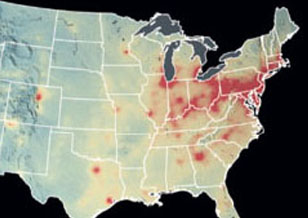
TES retrievals show consistent dependence on concentration of livestock facilities
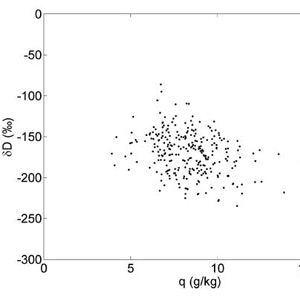
TES vapor isotope measurements provide details about moist processes in the atmosphere and how they should be represented in climate models.
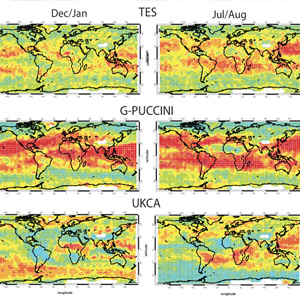
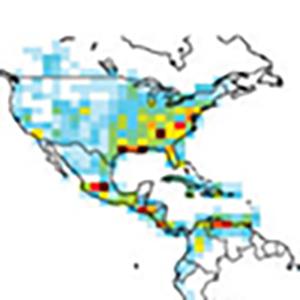
Global correlation patterns of ozone and CO derived from TES observations and model simulations
For the first time, NASA scientists have used a shrewd spaceborne detective to track the origin and movement of water vapor throughout Earth's atmosphere.
Coincident measurements of tropospheric ozone and carbon monoxide are critical for understanding chemical and dynamical processes, which can be very complex in the troposphere.
The hydrological cycle acts differently in different location. The TES measurements show that in the tropics, re-evaporation of precipitation is an important process controlling cloud formation.
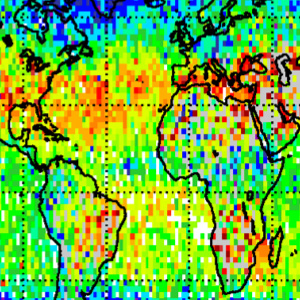
HDO measurements tell us about ice cloud formation and evaporation. This is the first map of HDO ever made.
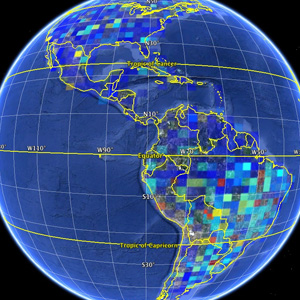
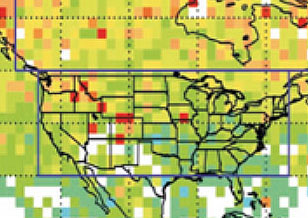
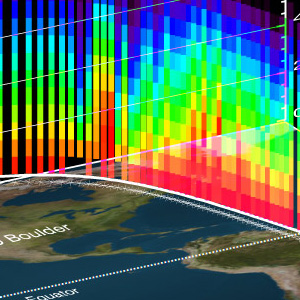
High values of CO near biomass burning regions and NH cities. CO in the upper trop is lofted by convection and fires.
The AIRS-visible images (left) show the TES footprint locations (blue) over a variety of cloud and surface conditions.