By Alan Buis | NASA JPL Part 1: (TES) Earth's Security Blanket Part 2: Getting a Handle on Carbon Dioxide Part 3: (MLS and OMI) Tracking the Ongoing Recovery of Earth's Ozone Hole Part 4: (OMI) Fresh Insights on Air Quality, Ozone and Climate
Constraining the hydroxyl radical in the tropics
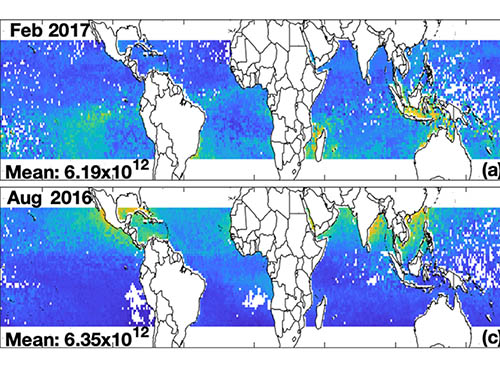
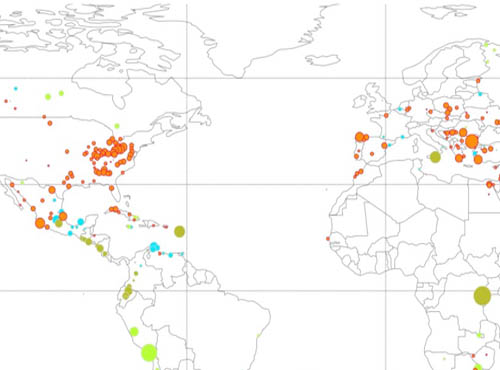
Combined catalogue of sulfur dioxide emissions
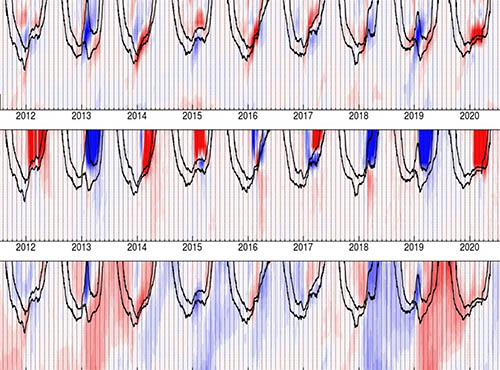
Signatures of Anomalous Stratospheric Polar Vortex Transport
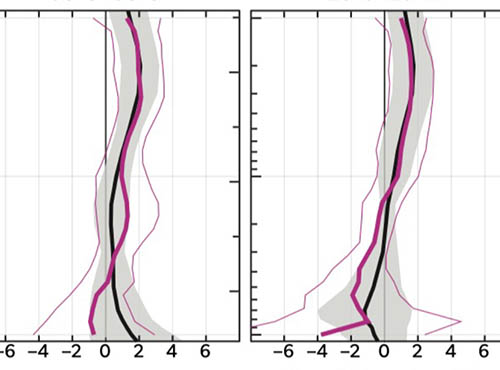
Earth’s ozone layer on track to recover within decades