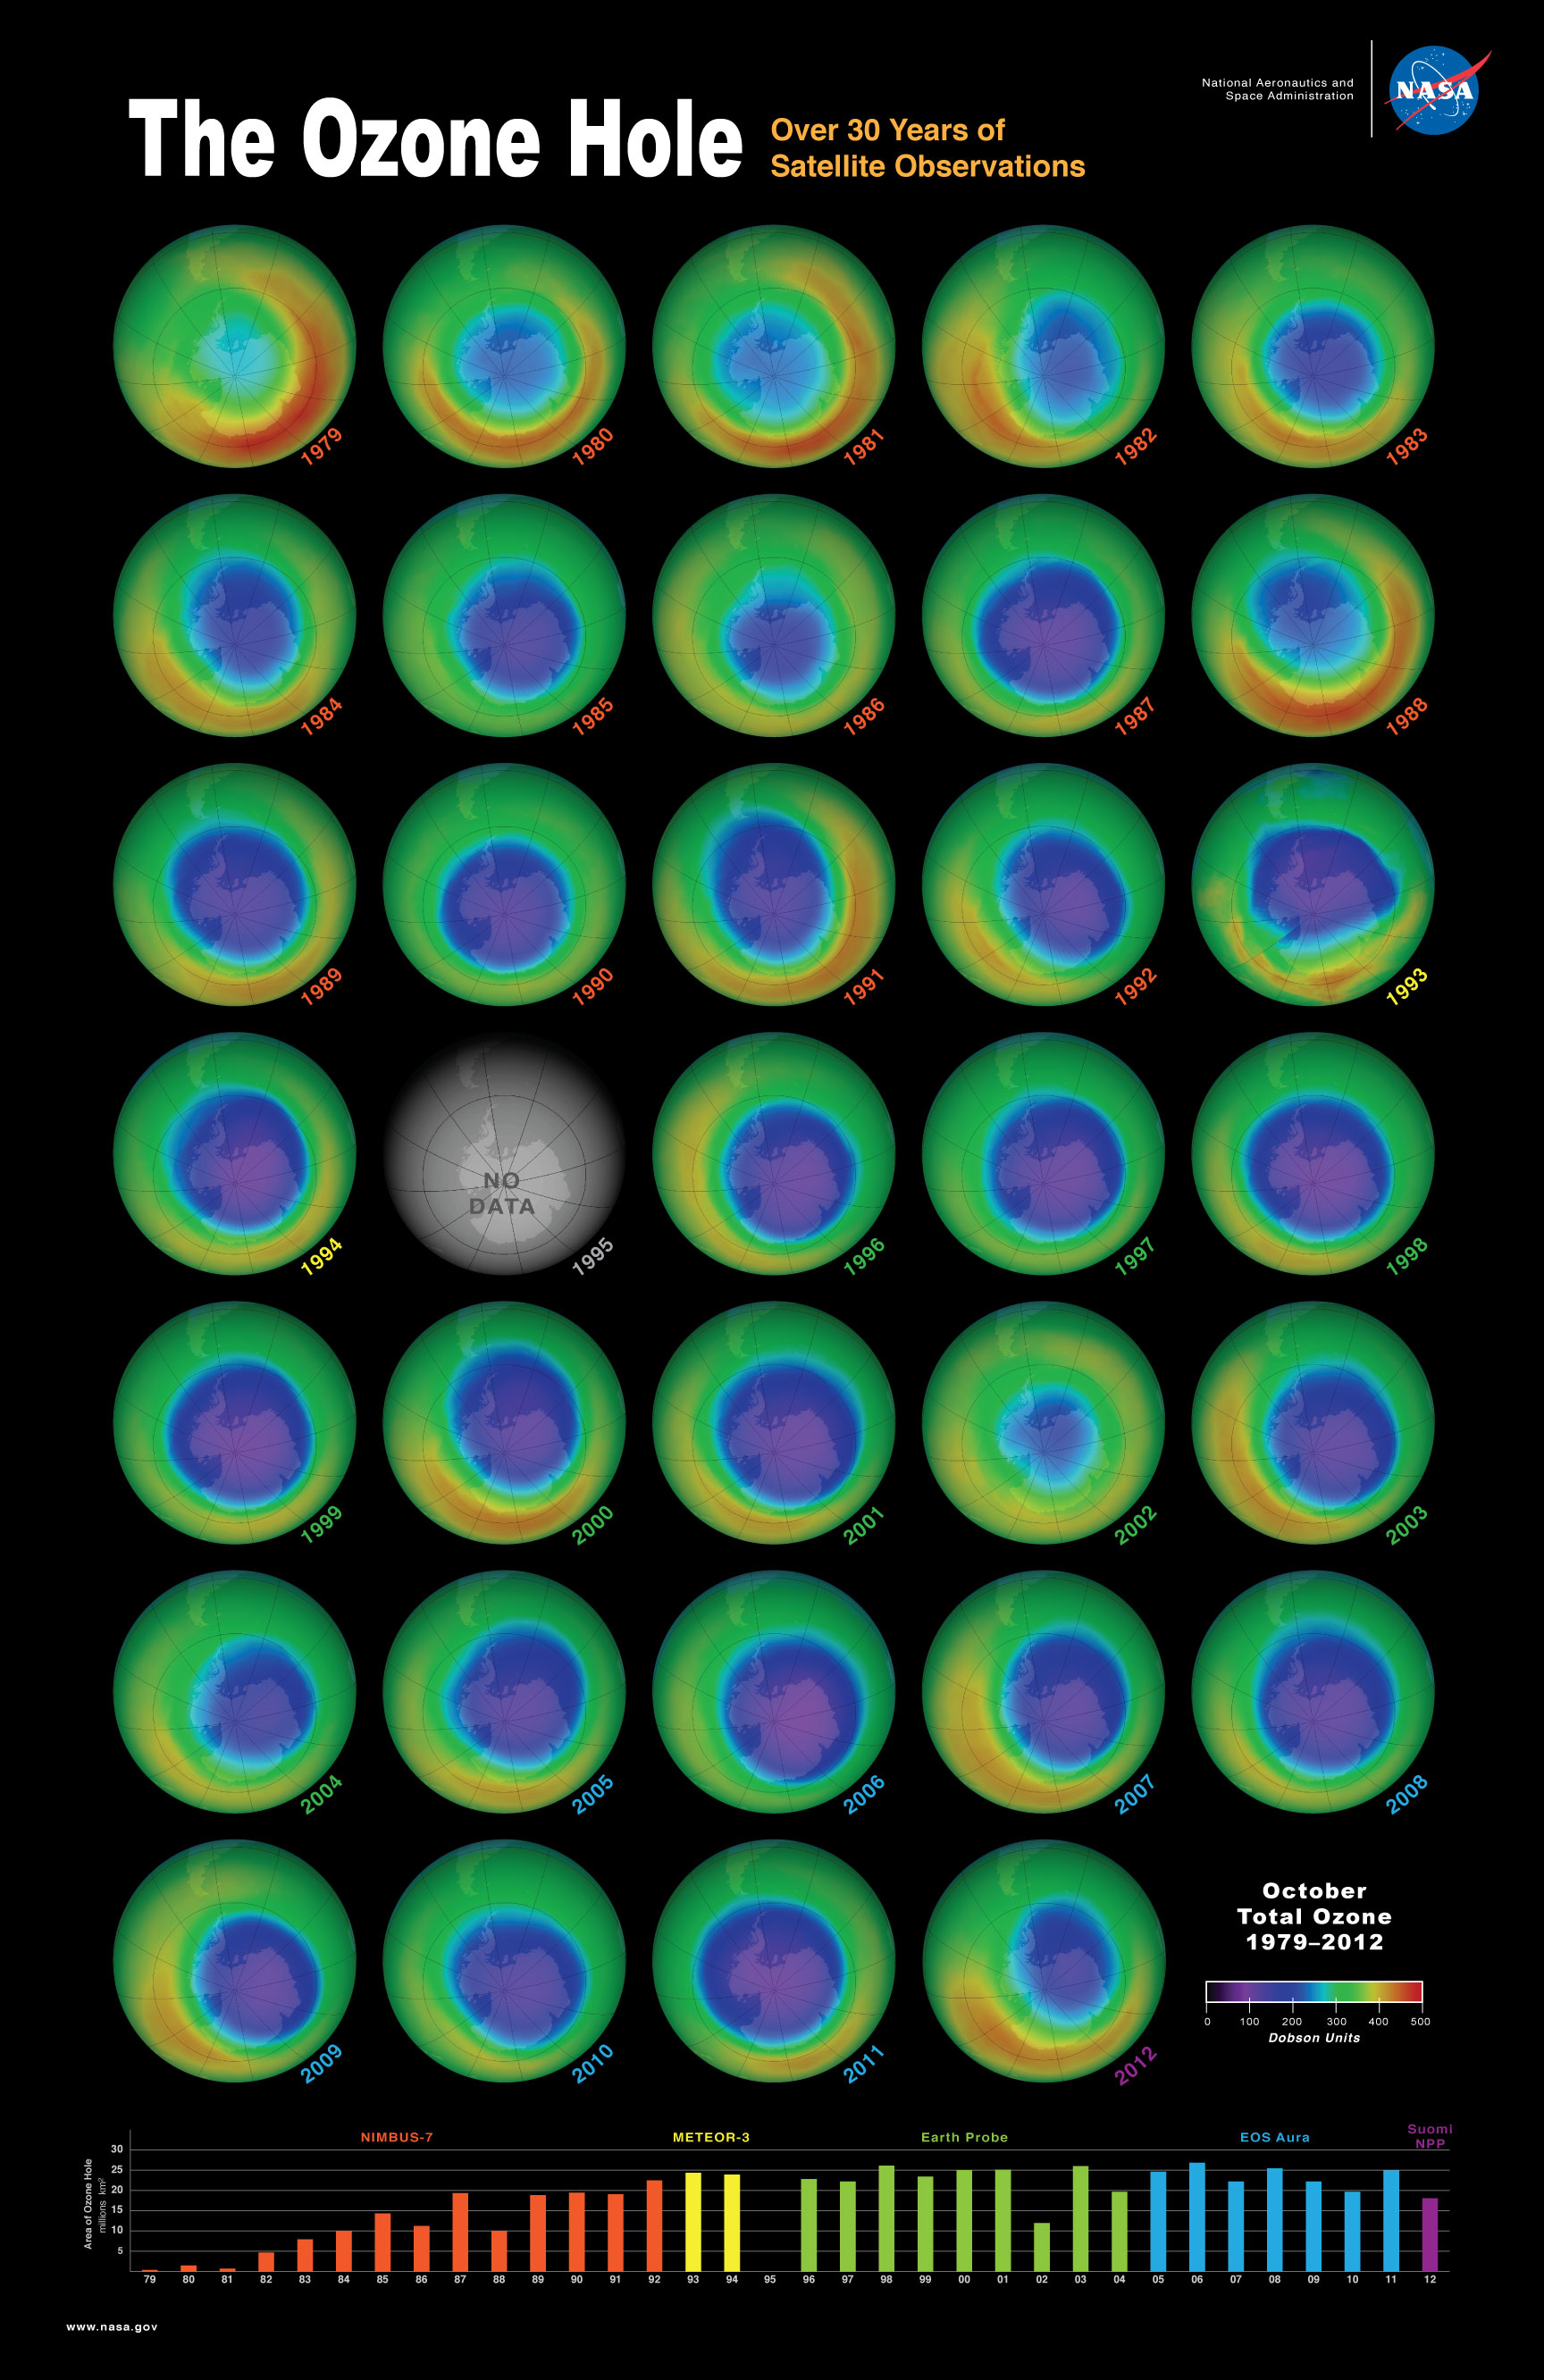
his poster illustrates data from five different missions that tracked the development of the ozone hole from space. Data is presented on globes showing the total column ozone in the month of October from 1979-2012.
[600KB/JPG] | [625KB/PDF]
The back of the poster provides information about stratospheric ozone: what is ozone, how ozone forms, and the processes that lead to the formation of an ozone hole. A timeline highlights the average area of the ozone hole and the emissions rates of human-produced ozone-depleting substances. An activity is included to introduce students to how scientists visualize satellite data using color maps. [2MB/PDF]
The content on the back of the poster is also available as a printable booklet. [4.4MB/PDF]
This lesson will introduce students to the use of color maps to visualize data about stratospheric ozone. Scientists use colors and other representations for data to help interpret and visualize information. BONUS: An extension activity not included on the poster is available in this document. [1.3MB/PDF]
Esta lección presenta a los estudiantes el uso de mapas de colores para visualizar datos sobre el ozono estratosférico. Los cientí- ficos usan colores y otras representaciones de datos para ayudarles a interpretar y visualizar la información . EXTRA: Este documento contiene una actividad de extensión no incluida en el póster. [1.3MB/PDF]

