The MLS instrument will provide measurements of many chemical species involved in the destruction of stratospheric ozone. This instrument is a greatly enhanced version of the UARS MLS instrument, including use of latest technology to measure important species such as OH , BrO and many others which could not be measured by MLS at the time the UARS instrument was developed, as well as more precise measurements and measurements over a larger altitude range. The Aura orbit will allow MLS measurements to be made to high latitudes every day on each orbit, whereas the UARS orbit required MLS high-latitude coverage to switch, approximately monthly, between the northern and southern hemispheres with critical periods being missed.
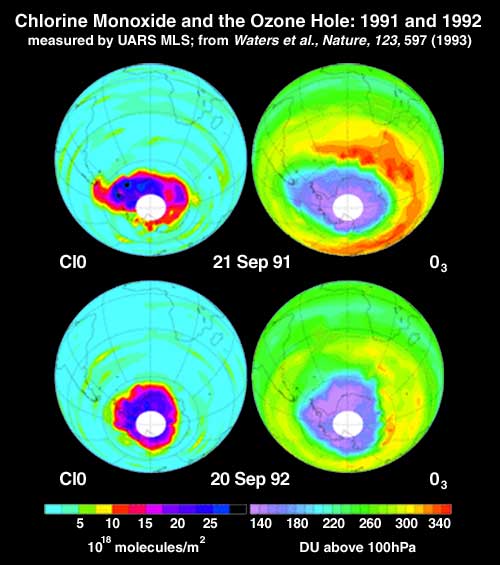
Chlorine monoxide (ClO) and ozone (O3). ClO is the predominant form of reactive chlorine that destroys stratospheric ozone. These maps of ClO and ozone were made by the Microwave Limb Sounder on NASA 's Upper Atmosphere Research Satellite (UARS). The map on 21 September 1991 is the first ever made of ClO , and was obtained fewer than 10 days after launch of UARS . The full extent of correlation between enhanced ClO and depleted ozone is evident in these results. ClO becomes enhanced over the Antarctic because of processes triggered by polar stratospheric clouds (PSCs) which form at low temperatures. These processes lead to the conversion of chlorine already in the stratosphere from relatively 'safe
' forms to the reactive forms, such as ClO , which destroy ozone. [For more information, see J.W. Waters et al., Nature, Vol . 362, pp . 597-602 (1993)]
The images show MLS O 3 & ClO measurements made during development of the 1996 Antarctic ozone hole. There are no such measurements at this time in 1997 due to degradation of the UARS power supply system. Timely delivery of the EOS Aura mission will allow for continuation of measurements which are critical for understanding ozone depletion.
The plots above show MLS measurements from 1993 and 1992 in both the Arctic and Antarctic regions of ClO and HNO 3. The EOS Aura MLS instrument will be able to take measurement of both hemispheres every day on every orbit, something that UARS MLS instrument is not able to do
The above plot shows ClO , HNO3 and O 3 measurements made by UARS / MLS in February 1996 for the northern hemisphere.
Temperature (T) and chlorine monoxide (ClO) in the northern hemisphere lower stratosphere. ClO , the predominant form of reactive chlorine that destroys ozone, can become enhanced when lower stratospheric temperatures are below ~195 K . Polar stratospheric clouds occur at these temperatures and trigger processes which convert chlorine in the stratosphere to reactive forms. This figure shows the striking difference in northern hemispheric ClO abundance on 15 February 1993 when temperatures were slightly below 195 K , and on 15 February 1992 when temperatures were slightly above 195 K . Increasing greenhouse gases will cool the lower stratosphere and, while stratospheric chlorine abundance remains high, exacerbate ozone depletion by this process.
The ClO data are from the Microwave Limb Sounder on NASA 's Upper Atmosphere Research Satellite and the temperature data are from NOAA 's National Meteorological Center. [For more information, see J.W. Waters et al., Nature, Vol . 362, pp . 597-602 (1993); J.W. Waters et al., Geophysical Research Letters, Vol . 22, pp . 823-826 (1995)]
JWW:CL.T.FEB.TEX (April 27, 1995)
Enhanced ClO in the Arctic and Antarctic winter vortices. Chlorine monoxide (ClO) is the predominant form of reactive chlorine that destroys ozone. These maps are from the Microwave Limb Sounder experiment on NASA 's Upper Atmosphere Research Satellite and show the enhanced abundance of ClO which occur in both the Arctic and Antarctic. White contours indicate the approximate edge of the polar vortices, and green contours indicate where temperatures are low enough for the polar stratospheric clouds which trigger ClO enhancement. The long duration of enhanced ClO in the Antarctic leads to the ozone hole.
Arctic ClO abundance is comparable in both magnitude and spatial extent to those in the Antarctic, but occurs over a shorter period of time with consequently less ozone depletion. [For more information see, J.W. Waters et al., Nature, Vol . 362, pp . 597-602 (1993); J.W. Waters et al., Geophysical Research Letters, Vol . 20, pp . 1219-1222 (1993)]
JWW:CLN59192.TEX (April 27, 1995)
The plots illustrate the dominance of downward transport increasing ozone in early winter and chemistry depleting ozone in mid-late winter.
Interhemispheric Differences in Stratospheric Nitric Acid. Substantial interhemispheric differences exist in the behavior of lower stratospheric nitric acid (HNO3), as shown in these maps from the Microwave Limb Sounder on the Upper Atmosphere Research Satellite. The colder Antarctic stratosphere has a greater removal of HNO 3, through sedimentation of polar stratospheric cloud particles, than the Arctic. The presence of HNO 3 moderates chlorine depletion of ozone, but increasing abundance of greenhouse gases will cool the stratosphere and could lead to decreased HNO 3 and more ozone depletion in the Arctic.
The color bar gives HNO 3 abundance in parts per billion by volume. White contours show the approximate edge of the polar vortices. Black contours show temperatures of 195 and 190 K ; polar stratospheric clouds can form when it is colder than ~195K. [for more information, see M.L. Santee et al., Science, Vol 267, pp 849-852 (1995)]
JJW HNOND.TEX (April 26, 1995)

