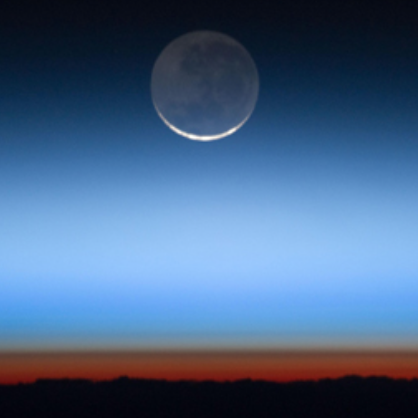
These set of lesson plans use real NASA data to help students understand how ozone can be both "good up high and bad nearby." Students will explore how scientists use data to describe the atmosphere. Students will practice graphing skills to analyze human impacts on ozone concentrations on the ground and high in the atmosphere.
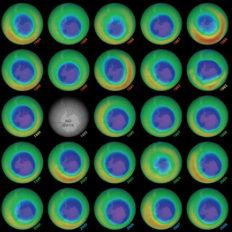
This will introduce students to the use of color maps to visualize data about stratospheric ozone.
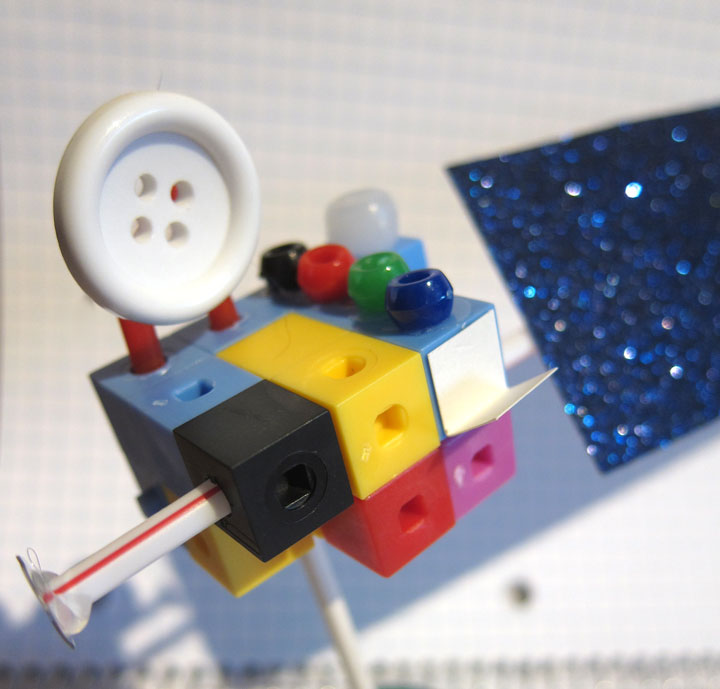
In this activity, you will select the scientific instruments for your satellite, calculate the power requirements for all the subsystems, and construct a scale model of your very own Earth observing satellite.
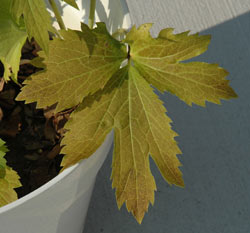
The Aura Ozone Monitoring Garden is breaking new grounds at Goddard's visitor center. It's the magic of plants making the invisible, visible. Bringing down to earth what remote sensing observations are telling us.
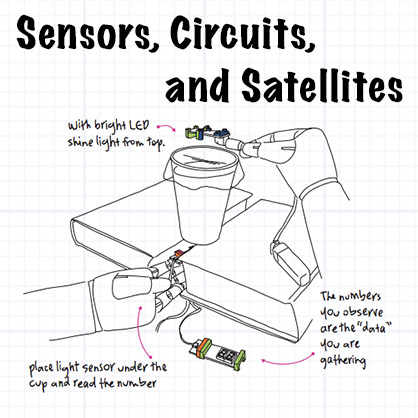
Lessons that integrate inquiry with active-learning experiences to engage students in the properties of electromagnetic energy and remote sensing. The investigations are sequenced to help the learner construct their knowledge about the electromagnetic spectrum while offering real world examples from NASA. Created in collaboration with littleBits™ with companion activities available online.
Get the latest status of the ozone layer over the South Pole. Satellite instruments monitor the ozone layer, and the data is used to create images that depict the ozone.
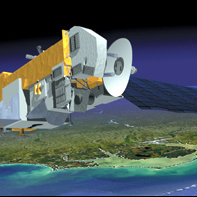
The Earth Observatory introduces Aura and answers questions such as: Is the stratospheric ozone layer recovering? What are the processes controlling air quality? How is our climate changing?
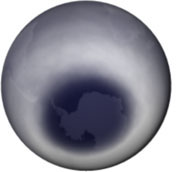
Ozone... what is it, and why do we care about it? Information on Ozone Balance in the Stratosphere, Ozone Depletion, and Monitoring Ozone from Space