The Montreal Protocol, an international treaty designed to protect the ozone layer, and its amendments have banned the use of ozone destroying chemicals. Since the Montreal Protocol was signed in 1987, more than 100 nations have agreed to limit the production and release of compounds, notably human-produced chlorofluorocarbons, known as CFCs. The rate of ozone depletion seems to have slowed. The size and depth of the ozone hole have stabilized. The success of the Montreal Protocol is emerging in NASA satellite data. Important questions remaining: When will it begin to recover? Will it recover fully to pre-1970 levels? Time will tell.
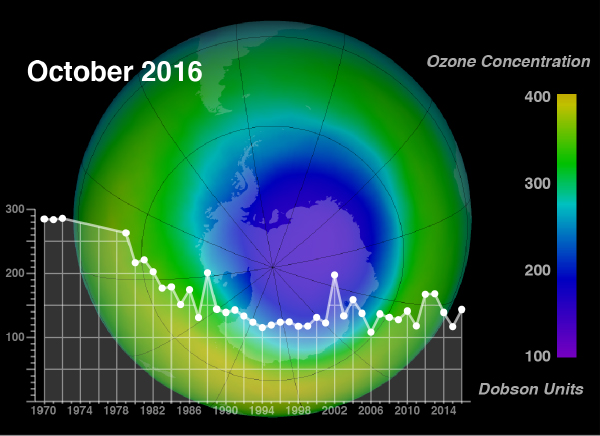
Ozone Monitoring Instrument (OMI) continues to observe stratospheric ozone, a record begun in 1970 with Nimbus-4/Backscatter Ultraviolet (BUV).
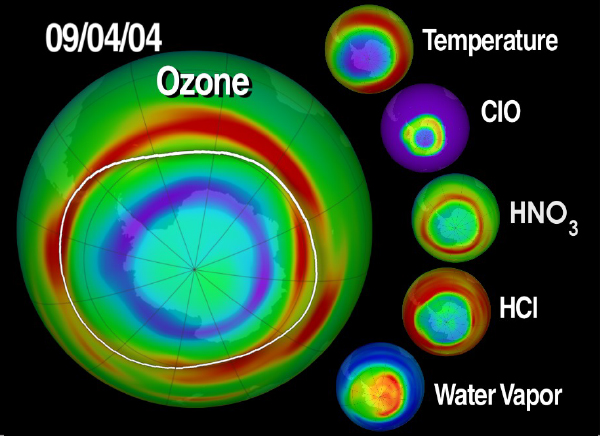
Microwave Limb Sounder (MLS) makes vital contributions to our understanding of the chemical & dynamical processes that affect the stratospheric ozone layer. Many of the MLS products are now unique with the loss of ESA's Envisat in 2012.
NASA satellites, such as Aura's Ozone Monitoring Instrument (OMI) and Microwave Limb Sounder (MLS), monitor the health of the Earth's ozone layer and provide insight into the complex chemistry and dynamics that influence it.
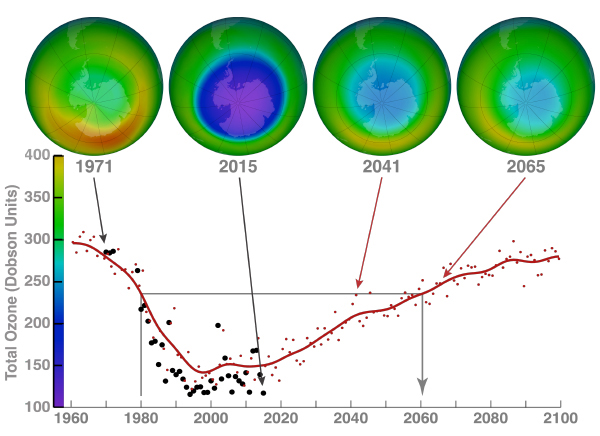
This understanding allows for the development of models, which predict the Antarctic ozone hole will recover in the latter half of this century.
Upper panels: False color images of October average total column ozone (Dobson units). The 1971 and 2015 panels are observations derived from the NASA Nimbus-4 BUV instrument and the NASA Aura satellite's Ozone Monitoring Instrument (OMI, KNMI), respectively. The 2041 and 2065 panels are from a NASA/GSFC GEOSCCM model simulation using projections of ozone depleting substances (ODSs) and greenhouse gases (GHGs). The color scale for total ozone is on the right hand side. High ozone values are in red/yellow while low values are blue/purple.
Lower panel: The lowest values from the October average over Antarctica. The black dots are observations from the BUV instrument, the Total Ozone Mapping Spectrometer (TOMS), and the OMI instrument. The red dots are from NASA/GSFC GEOSCCM model simulation. The red curve shows the smoothed values of the red points (10-year Gaussian filter).
The world shows intriguing spatial heterogeneity and changes from 2005 to 2014 in NO2, a common pollutant from power plants and automobiles.
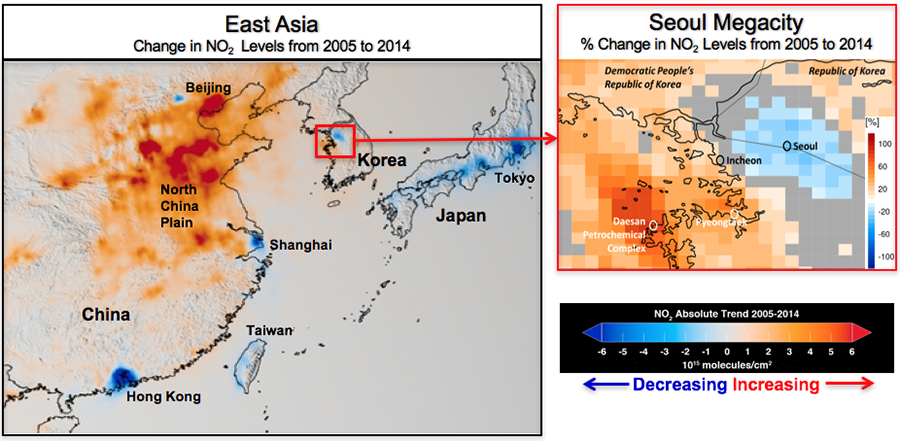
The North China Plain shows rapid growth until ~2011 in China's manufacturing heartland, followed by the gradual introduction of emission controls. Emission controls implemented before 2010 in Japan, Taiwan, Beijing, Shanghai, and Hong Kong.
Complex changes in the Seoul Metropolitan Area are likely associated with pollution emission controls in Seoul (decreases) & ambitious infrastructure development (increases) of the Incheon Free Economic Zone, Incheon International Airport, & Daesan Petrochemical Complex.
Nitrogen Dioxide is a common pollutant from power plants & automobiles. It damages ecosystems via acid deposition & eutrophication and is a precursor to atmospheric particulates & ozone, which damage our lungs. Ozone also affects plants, such as reducing crop yields.
The Clean Air Act is the comprehensive federal law that regulates air emissions from stationary and mobile sources. Among other things, this law established National Ambient Air Quality Standards to protect public health and public welfare and to regulate emissions of hazardous air pollutants. Pollutant emission controls have led to a dramatic reduction in NO2 (20-60%) and, subsequently, ozone (~15%) over the US from 2005 to 2014.
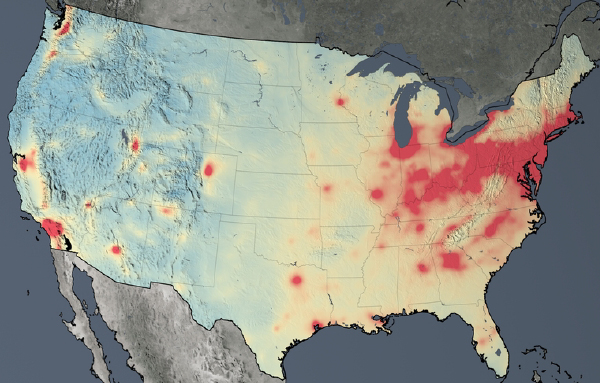 NO2 Levels in 2005
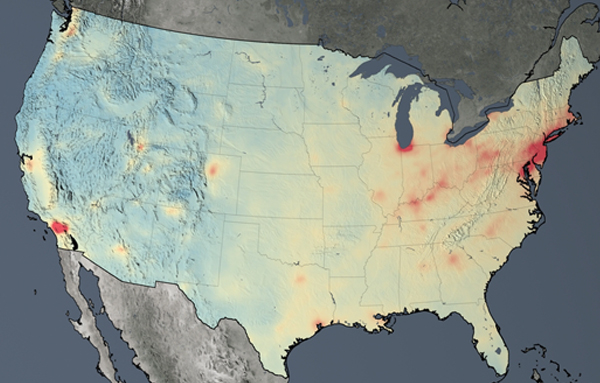 NO2 Levels in 2014
View Original Presentation (PDF) | View Lenticuar Publication (PDF)

