The High Resolution Dynamics Limb Sounder (HIRDLS) on the Aura satellite measures temperature profiles of the atmosphere, revealing small-scale atmospheric buoyancy waves (also known as "gravity waves") in fine detail. Flow over mountains generates gravity waves, and where these waves cause local temperatures to drop, ice clouds can form, sometimes even in the very dry polar winter stratosphere, where the formation of such clouds is associated with polar ozone destruction. Breaking gravity waves also can also cause turbulence felt by aircraft. Although gravity waves tend to be small in scale and occur as sporadic events, collectively these waves are also responsible for driving global-scale winds that affect weather and climate. To understand these global-scale wind effects, researchers must estimate the wave momentum fluxes, which require measurements with very high horizontal and vertical resolution.
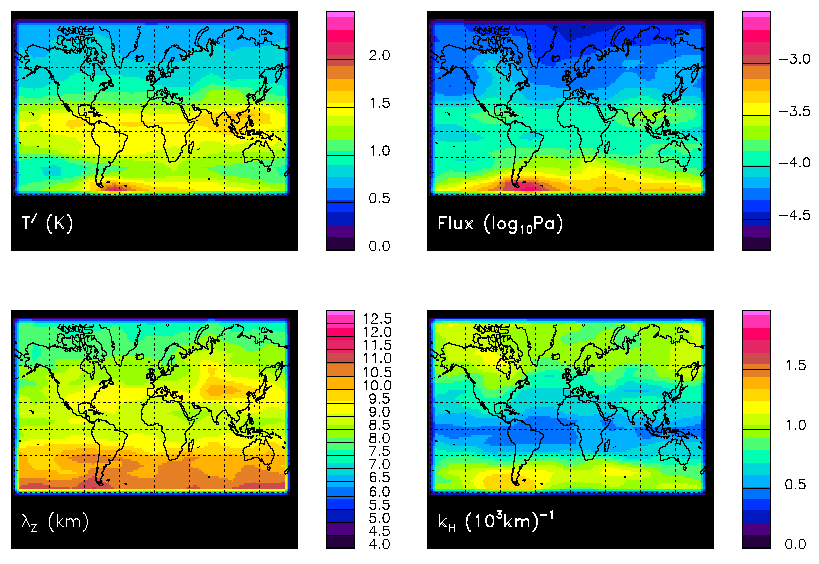
Figure 1. Maps of gravity wave temperature amplitude ($T^\prime$), momentum flux (Flux), vertical wavelength ($\lambda_Z$), and horizontal wavenumber ($k_H$) averaged between 20-30km altitude and averaged over a 27-day time period in May 2006.
In a NASA funded study led by Dr. Joan Alexander of NorthWest Research Associates collaborating with Dr. John Gille and his colleagues at the National Center for Atmospheric Research and the University of Colorado, researchers have analyzed HIRDLS data to produce daily global maps of gravity wave momentum flux that identify the locations and sources of intermittent gravity wave events. The study identifies waves in adjacent HIRDLS temperature profiles, and estimates the temperature amplitude and horizontal and vertical wavelengths for each profile pair. From the results, maps of momentum flux can be estimated. The average for a 27-day period in May 2006 at 25-km altitude is shown in Figure 1. In comparison to the temperature amplitudes, the momentum flux emphasizes the waves with longest vertical wavelength and largest horizontal wavenumber. The location of the largest fluxes is near the Patagonia region of South America, a region where mountain waves commonly occur.
Dots on the map in Figure 2 show the locations of individual HIRDLS profiles observed on a day when the wave temperature amplitude and momentum flux over Patagonia is twice the mean value. Two segments are highlighted (red and green lines) where HIRDLS observes a strong mountain wave event.
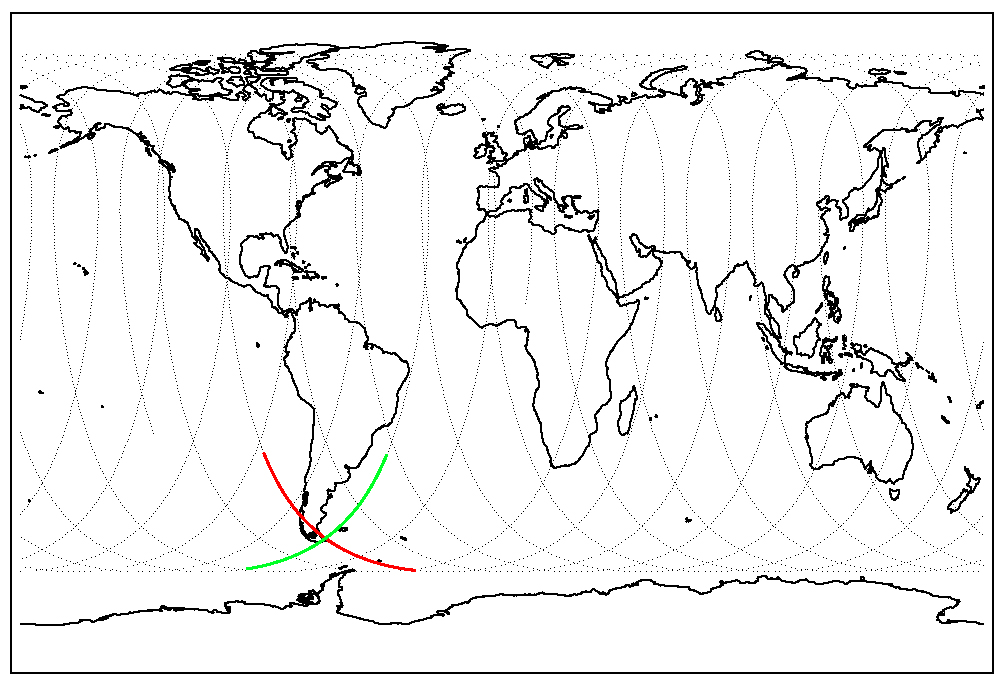
Figure 2. Map of the locations of HIRDLS temperature profiles obtained on 8 May 2006. Segments highlighted in red (ascending) and green (descending) are examined in detail in Figure 3.
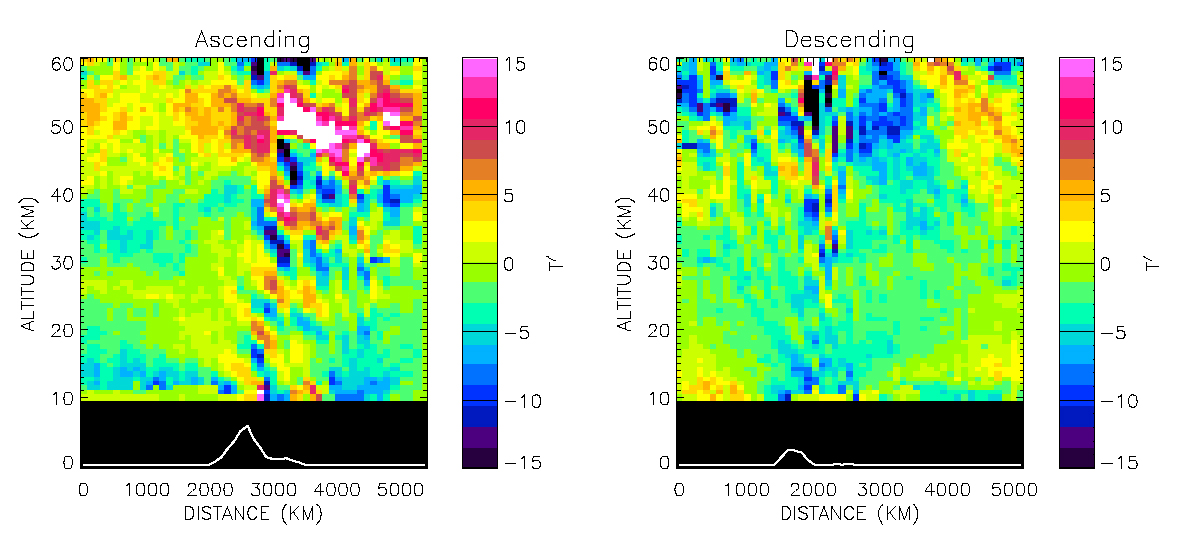
Figure 3. Wave temperature fluctuations shown as functions of horizontal distance and altitude along the two segments highlighted in Figure 2. The underlying topography (exaggerated by a factor of 5 for clarity) is also plotted below.
The temperatures obtained along these two segments are shown in Figure 3 as functions of horizontal distance along the orbit vs altitude. Large-scale mean temperatures have been removed to reveal the waves. The alternating red and blue colored regions show warm and cold temperature oscillations caused by the mountain waves. West is to the left in both panels. The mountain waves can be seen to extend to very high altitudes, up to 60 km (37 miles), into the region known as the mesosphere. Propagation of mountain waves into the mesosphere has been predicted in theoretical studies, but has not been previously unambiguously observed. The high resolution of the HIRDLS measurements allows researchers to study these waves in fine detail and to improved predictions of wave effects on the general circulation of the atmosphere.
Credit : M. Joan Alexander
3.09.07

