As tropical air rises into the stratosphere it carries with it trace gases, such as CFC's that are responsible for ozone depletion. In 1996, scientists analyzing Upper Atmosphere Research Satellite water vapor data found to their surprise that tropical air, once it entered the stratosphere, did not mix rapidly. Instead the air ascended very slowly retaining the trace gas signature imprinted in the lower atmosphere. This phenomenon was dubbed "the tape recorder". Water vapor values are "recorded" somewhere in the upper troposphere and the information ascends into the stratosphere like a magnetic tape moving away from the tape head. Water vapor amounts vary widely in the troposphere because water vapor is controlled by temperature which determines processes such as condensation and evaporation. The water vapor tape recorder thus carries information about the seasonal variation in the upper troposphere temperatures into the stratosphere.
In the paper referenced above we report the discovery of the carbon monoxide (CO) tape recorder using Aura Microwave Limb Sounding data. The imprint of CO at the tape head is quite unlike the imprint of water vapor because the CO concentration is not affected by temperature. The CO taper recorder instead carries information about the seasonal variations in tropical biomass burning, the major source of CO. The CO tape recorder can also tell us something new about the dynamics of the upper troposphere. We find that the tape head for CO and water vapor are approximately at the same altitude and that altitude is a few kilometers below the tropopause. This implies that tropical convection, which lofts CO from the boundary layer to the upper tropopause, does not control CO concentration all the way up to the tropopause. Convection's role in determining trace gas concentrations in the upper troposphere is limited and quickly fades above about 16 km (the tropopause is near 17.5 km). This result will help us improve our models of stratosphere-troposphere interaction and our ability to predict how the stratosphere will respond to climate change.
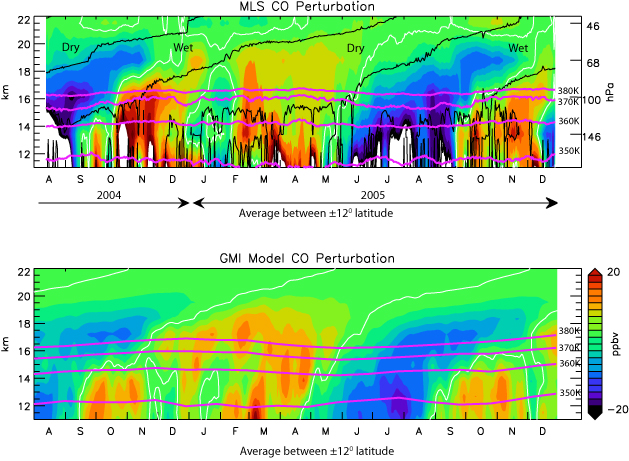
(top figure) Zonal mean MLS CO data with the annual average removed verses time (months). Altitude scale is 7 km log(1000/p) where p is pressure. Black lines show the zero contour for MLS water vapor tape recorder with 'wet' and 'dry' labels indicating the sign of the perturbation. White contours are zero lines for CO data. Right hand scale shows pressure levels for MLS level 2 data. Pink lines show the zonal mean potential temperature surfaces (350-380K).
(bottom figure ) GMI chemical transport model CO simulation using climatological sources. The GMI chemical model is driven by the GEOS-4 GCM meteorology with1994-5 observed sea surface temperature forcing.
3.01.2006

