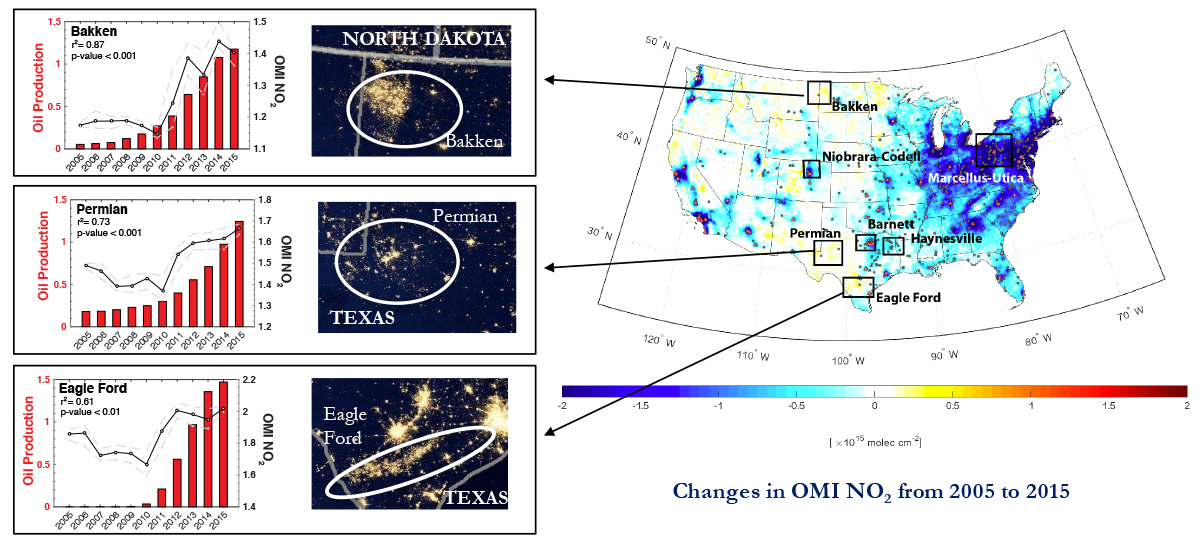
Map shows absolute changes in the OMI-NO2 vertical column density (VCD) between 2005 and 2015. Oil and natural gas regions (black boxes), large cities (red triangles) and power stations (grey circles) are overlaid. For three oil and natural gas regions (Bakken, Permian, and Eagle Ford), the lights at night data from Suomi NPP VIIRS and the relationship between annual OMI NO2 VCD and regional annual oil or gas production from 2005 to 2015 are displayed. The deseasonalised annual OMI NO2 VCD is shown in solid lines, with 95th percentile confidence bounds in dashed lines, and regional annual oil or gas production in red bars.
Scientific significance, societal relevance, and relationships to future missions:
Nitrogen oxides (NOx = NO2 + NO) are a highly regulated species that play a major role in the formation of photochemical smog. While NOx emissions are generally decreasing over the U.S. as a result of more stringent environmental policies and improved emissions control technologies on power plants and cars, the shale oil and natural gas industry is reversing this rate of changes in certain regions. We present here a quantitative analysis of NOx levels over the seven main U.S. shale plays (Bakken, Eagle Ford, Permian, Niobrara-Codell, Marcellus-Utica, Haynesville, and Barnett) between 2005 and 2015 using measurements of tropospheric NO2 from the Aura Ozone Monitoring Instrument (OMI). We develop and apply a methodology that seeks to maximise pollutant signals from oil and gas activities. For reference, we also examine the national trend averaged over the lower 48 states. Consistent with previous studies, we find NOx across the U.S. is generally declining. During the low-production phase of oil and natural gas production (2005-2009), we find declining trends in tropospheric NOx that are similar to the national trend (-4.6% yr-1) in 6 of the 7 study regions (-8 to -2% yr-1). In the high-production phase (2010-15), we find an increasing NOx trend in 5 of the 7 study basins (0.4 to 4.5% yr-1) while the national trend continued to decline (-0.3% yr-1). Over the most intensive oil-producing shale plays (Bakken, Eagle Ford, Permian and Niobrara-Codell), we observe a rapid growth (1-4.5% yr-1), which correlates well (r2 = 0.6-0.9) with their annual oil production rates and/or drilling rigs. In contrast, trends across the mainly gas-producing regions (Haynesville, Barnett, and Marcellus-Utica) show decreases (-0.4 to -1.7% yr-1) similar to the national trend, with the exception of the Marcellus-Utica where a slight increase (0.4 ± 0.2% yr-1) may be an indication of a small regional increase. Our study shows the important decadal effect that shale oil and natural gas operations has had on the tropospheric NO2 levels, and the potential consequences for regional air quality.
Currently, Aura overpasses once per day in the early afternoon, giving only a "snapshot" of NO2 levels. The upcoming NASA TEMPO mission, which will be in geosynchronous orbit, will allow the hourly evolution of NO2 emissions from ONG activities to be studied.
Data Sources:
Aura Ozone Monitoring Instrument (OMI) version 2.1 level 3 high-resolution (0.1°x0.1°) tropospheric vertical column density data of nitrogen dioxide (NO2) developed by NASA Goddard OMI Science team and available from the Aura Validation Data Center (AVDC) were used in this study. Data on national oil and natural gas production statistics and drilling rig counts were taken from the U.S. Energy Information Administration's (EIA) database. Spatial data on the extents of shale basins were from the EIA. Locations of oil and natural gas wells across the U.S. were downloaded from the The FracTracker Alliance. Population data were acquired from the U.S. Census Bureau.
References: Majid A., Val Martin M., Lamsal L.N., Duncan B.N. (2017). A decade of changes in nitrogen oxides over regions of oil and natural gas activity in the United States. Elem. Sci. Anth., 5:76. DOI: http://doi.org/10.1525/elementa.259.
12.28.2017

