Approaching its second anniversary since launching in July 2004, Aura has been retrieving information and producing valueable data of the Earth and its atmospheric properties. Each instrument working individually and alongside its counterparts to bring us ozone measurements, tropospheric maps of carbon monoxide and cloud ice, as well as measurements in the stratosphere.
Below are the selected top 10 discoveries that Aura's instruments have brought us so far.
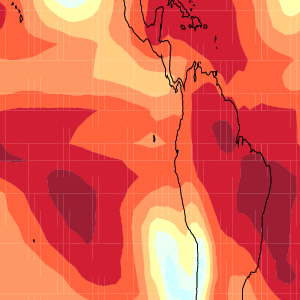
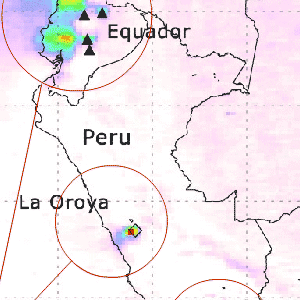 SO2Emissions from Smelters
The Peruvian copper smelters are among the world's largest industrial point sources of sulfur dioxide (SO2), and are among the most polluting in the world. OMI is sensitive enough to identify copper being emitted from the La Oroya and Ilo smelters even though these produce less SO2 than the volcanoes.
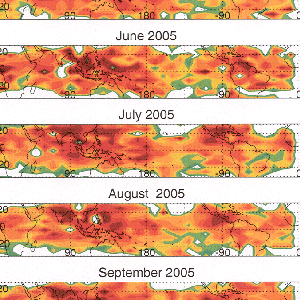
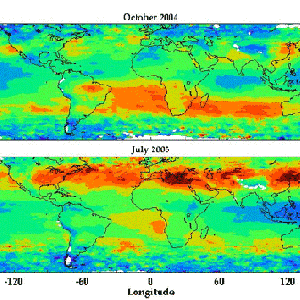 First global tropospheric maps show streams of tropospheric ozone crossing the oceans
OMI & MLS can estimate the tropospheric ozone residual by subtracting the MLS stratospheric ozone from OMI column ozone. These maps show pollution streaming from the U.S., Europe and China to the west in summer and pollution from biomass burning in the equatorial zone.
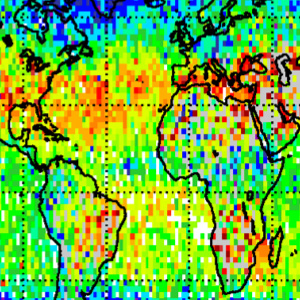 The greenhouse effect of tropospheric ozone
This map shows the longwave radiative effect of infrared radiation absorbed by tropospheric ozone as estimated from TES top-of- atmosphere observations.
 First Global Measurement of Cloud Ice in Upper Troposphere
Cloud ice measurement will improve global circulation models used for weather and climate forecasts.
The measurements will also help quantify the upper tropospheric hydrological cycle, including water vapor feedbacks on climate change.
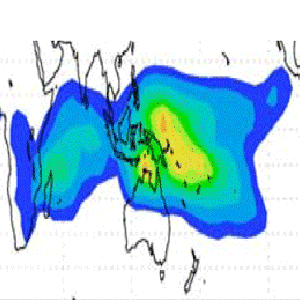
 First Maps of Sub-Visual Cirrus in the Upper Tropical Troposphere
MLS sees cloud ice, but HIRDLS sees the clouds themselves, even clouds that are so thin that people cannot see them. Just as in the MLS cloud ice map we see large amounts of this cirrus in regions of significant cloud ice.
 Water Vapor Isotopes
Stable isotopes from TES is used to constrain convective parameterization in a climate model.
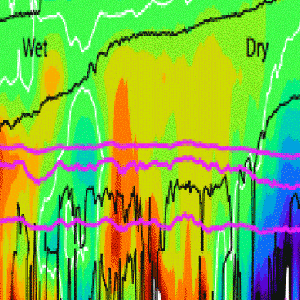 Measurement of CO in Upper Troposphere
CO is a signature of pollution and can be transported a long way from its source. Not surprisingly, that transport can be vertical as well as horizontal. These images show how CO detected in the lower stratosphere can tell us something about where convection is occurring.
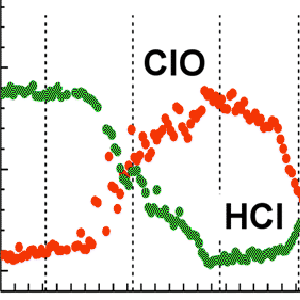 Continuous measurement of HCl in stratosphere
The continuous measurement of HCl in the stratosphere shows the rapid recovery of this major chlorine reservoir after polar ozone loss, and continues the long-term measurements from UARS HALOE. Monitoring HCl tells us about ozone loss processes and the recovery of the ozone layer.
 First Measurement of OH in the Middle Stratosphere
The MLS measurements of OH and HO2 have provided the first tests of global stratospheric hydrogen chemistry and resolved the disagreement between model estimates of OH and earlier observations - these data suggest earlier observations are suspect.
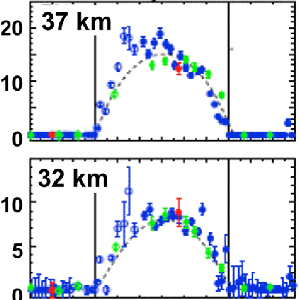
 First Global Measurement of Small Scale Gravity Waves in the Stratosphere
HIRDLS high resolution temperature measurements show short vertical wavelength gravity waves, permitting assessment of gravity wave forcing in the stratospheric circulation.
6.28.06

