
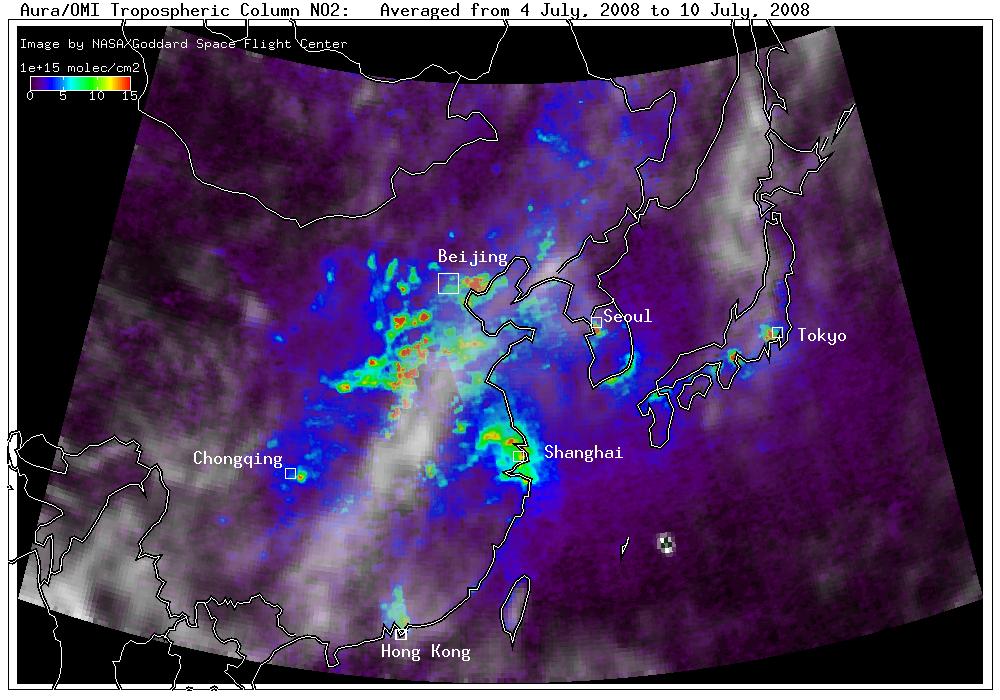
July 05
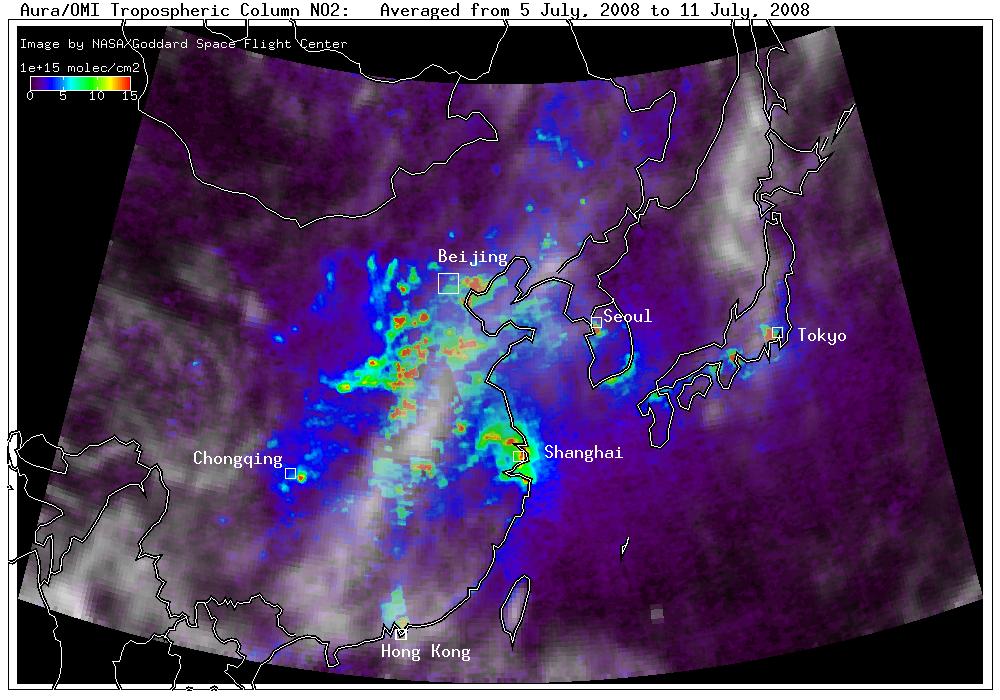
July 07
July 09
July 10
July 11
July 12
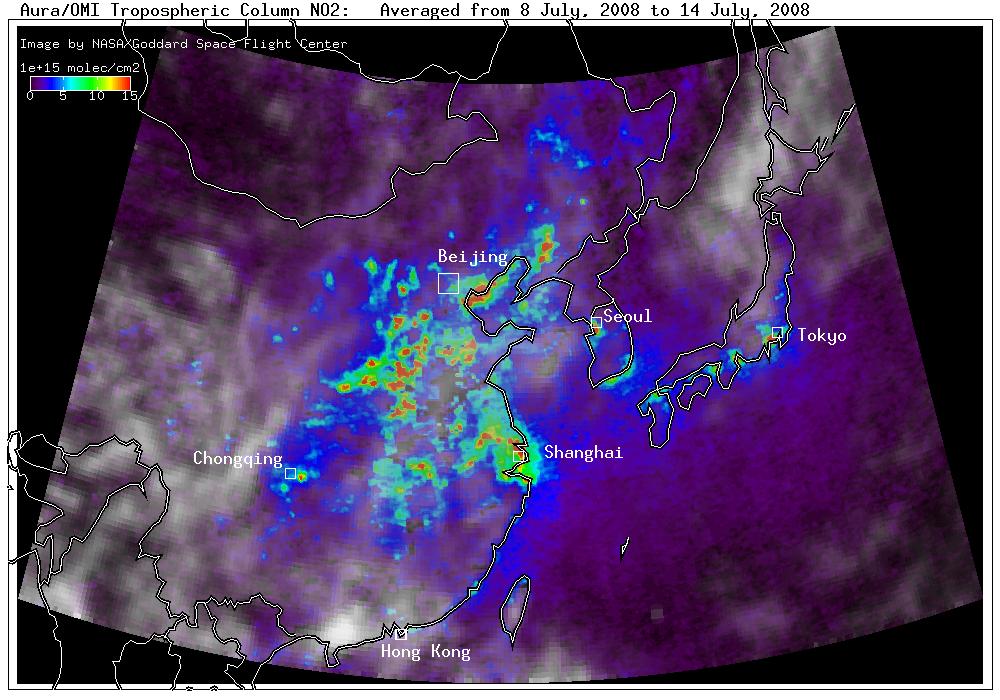
July 14
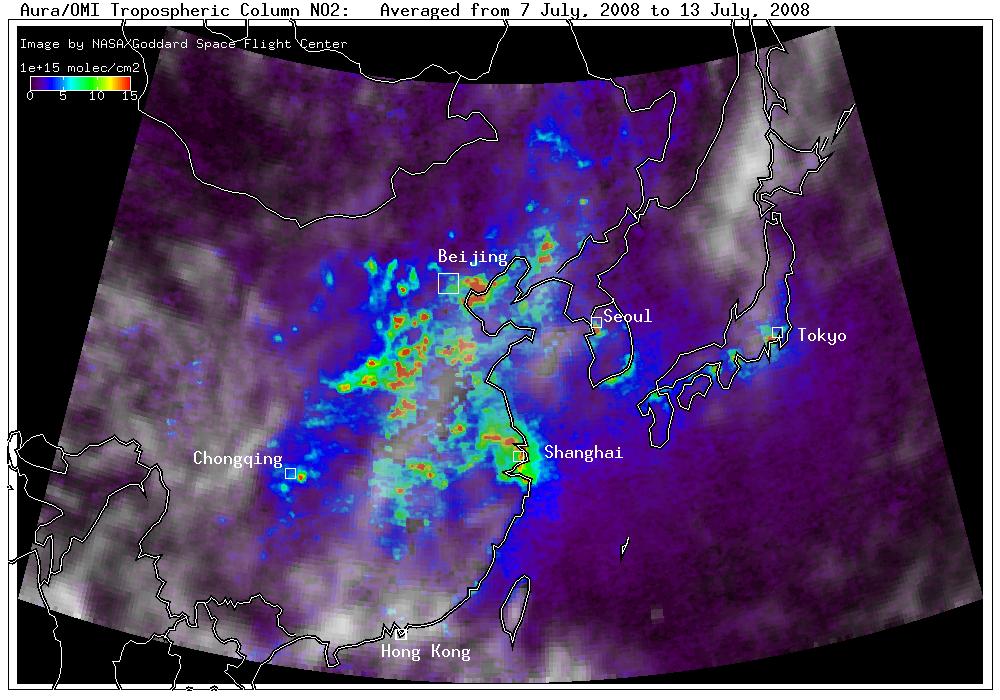
July 13
July 15
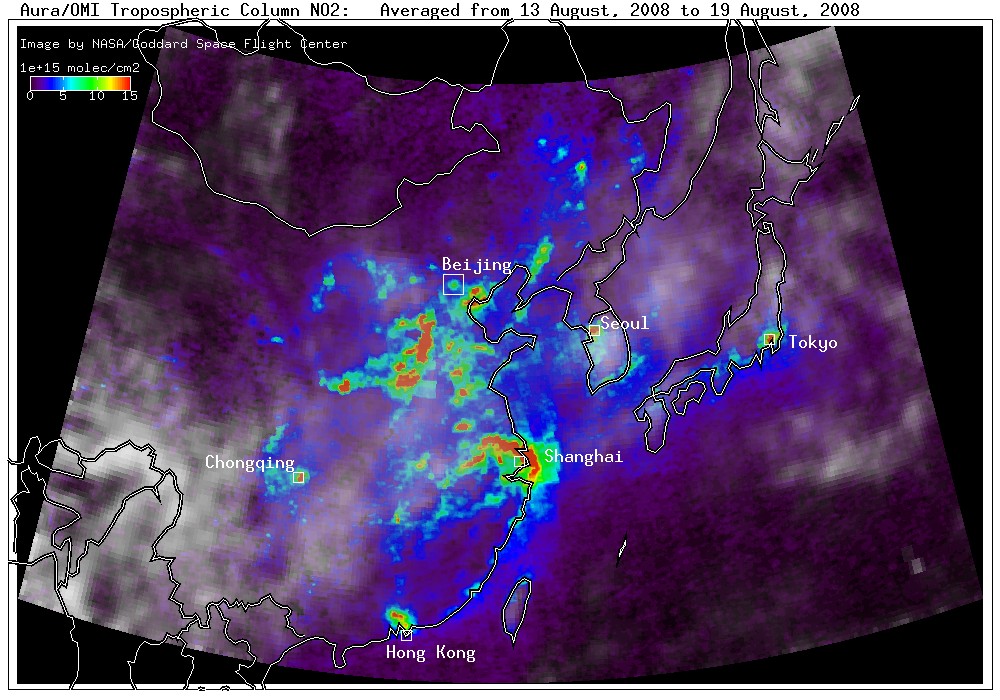
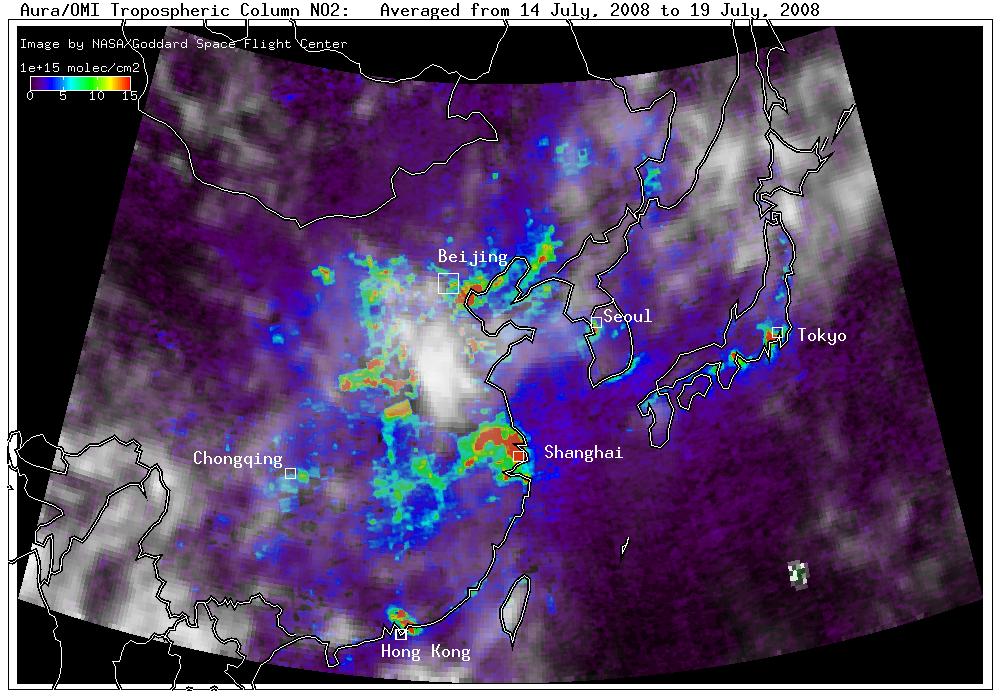
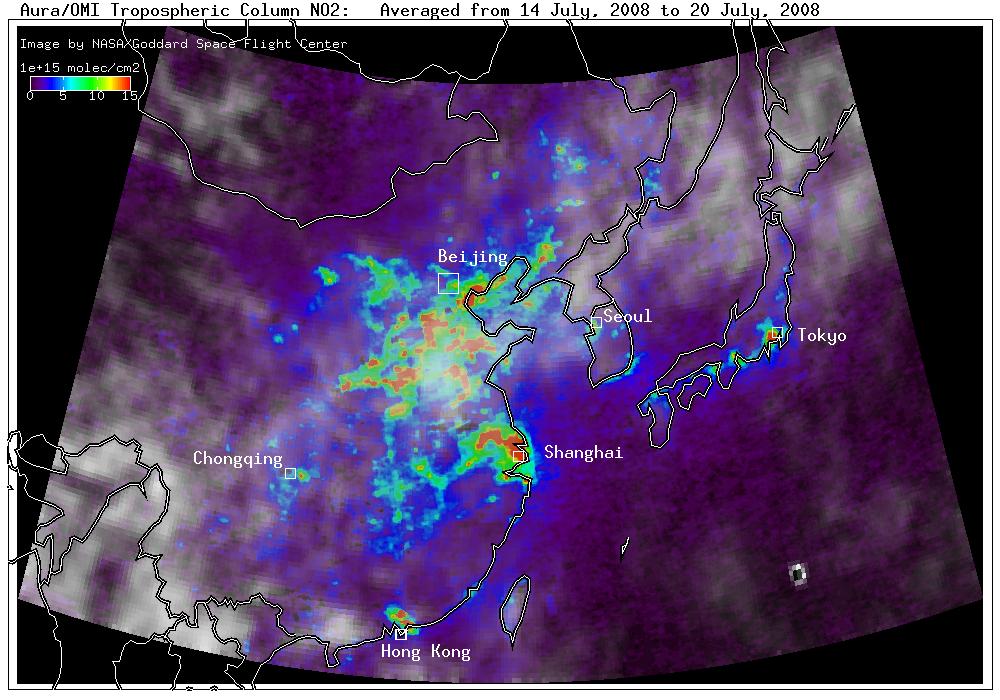
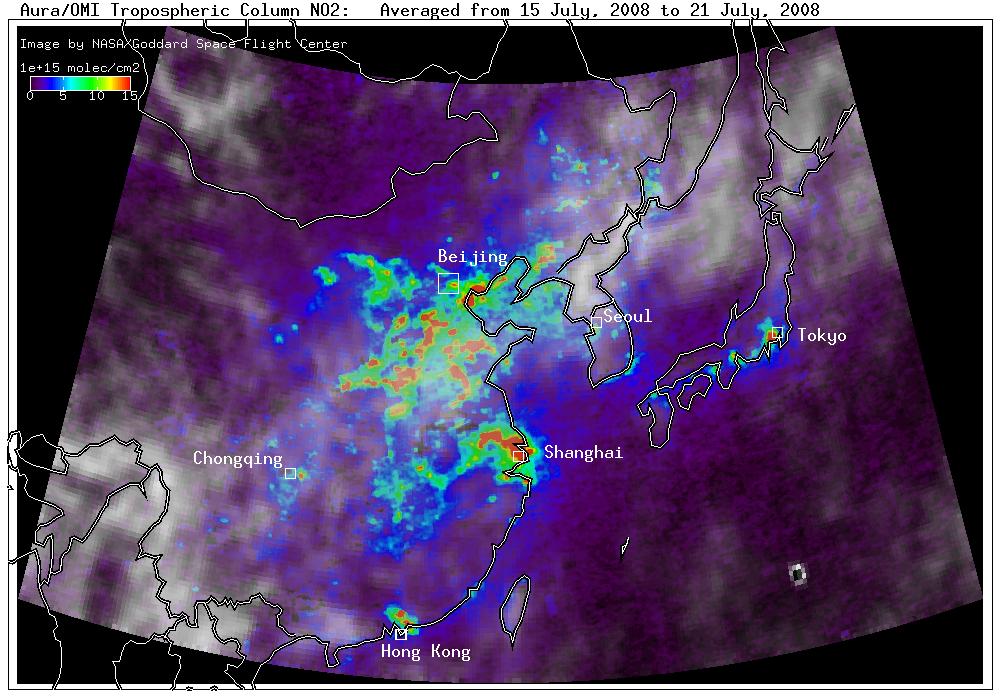
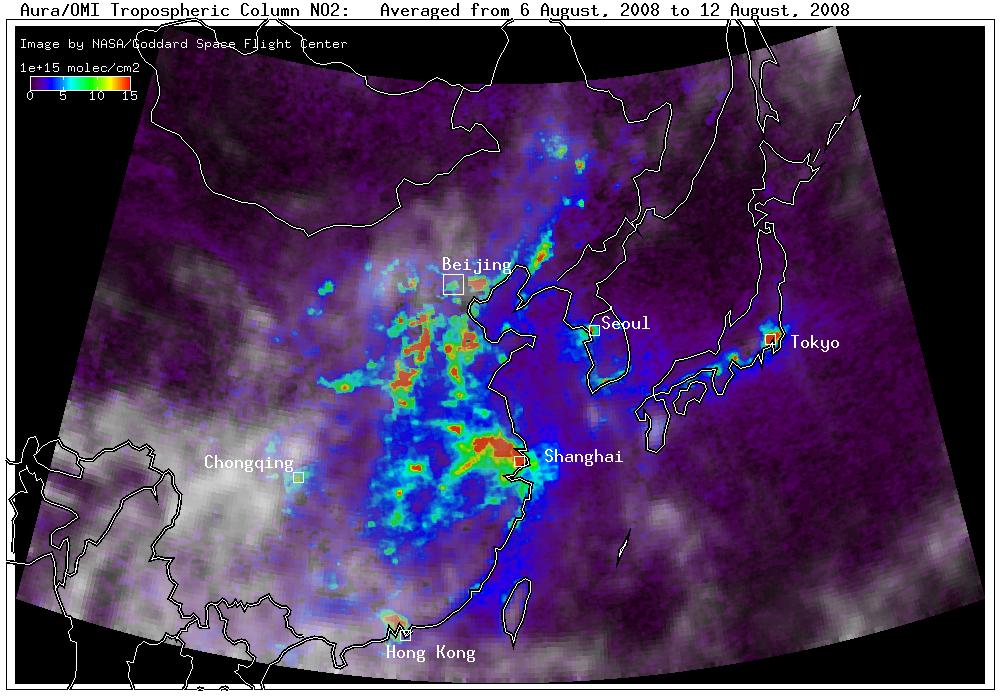
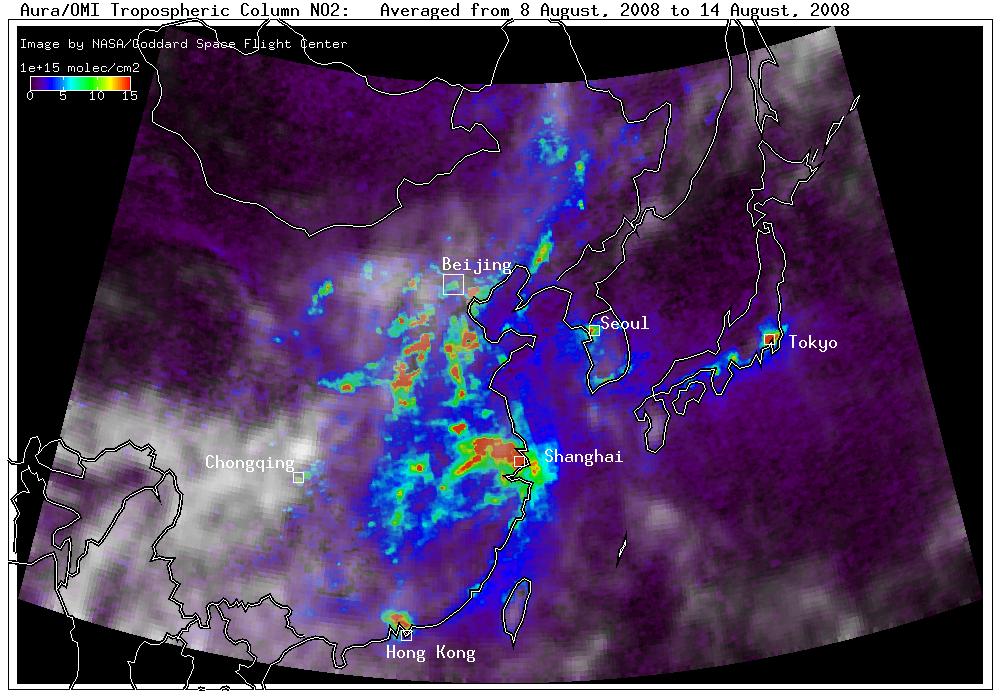
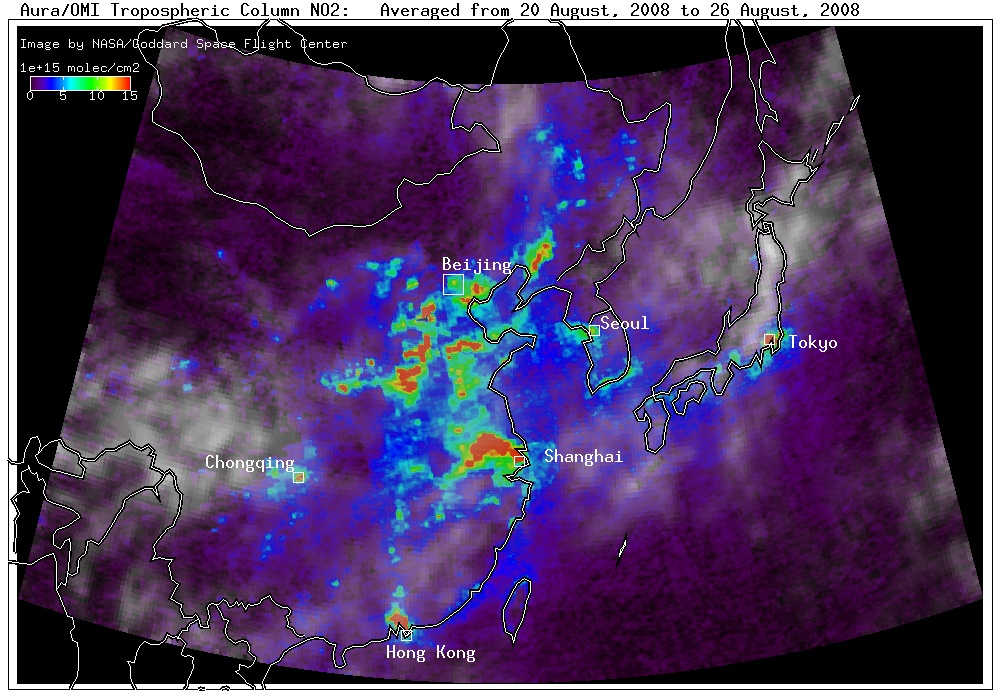
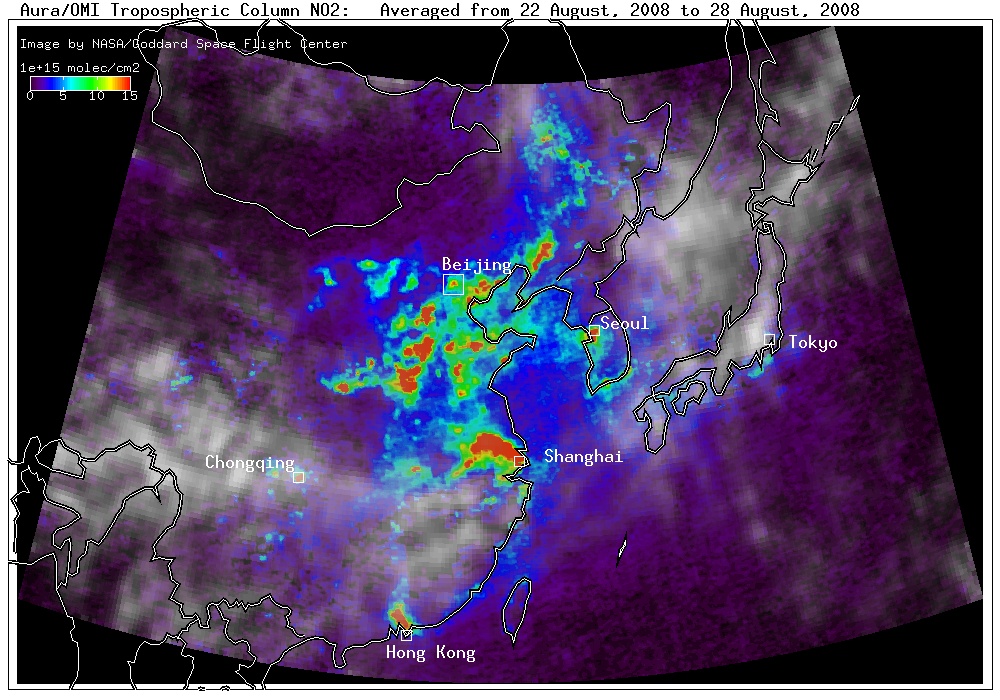
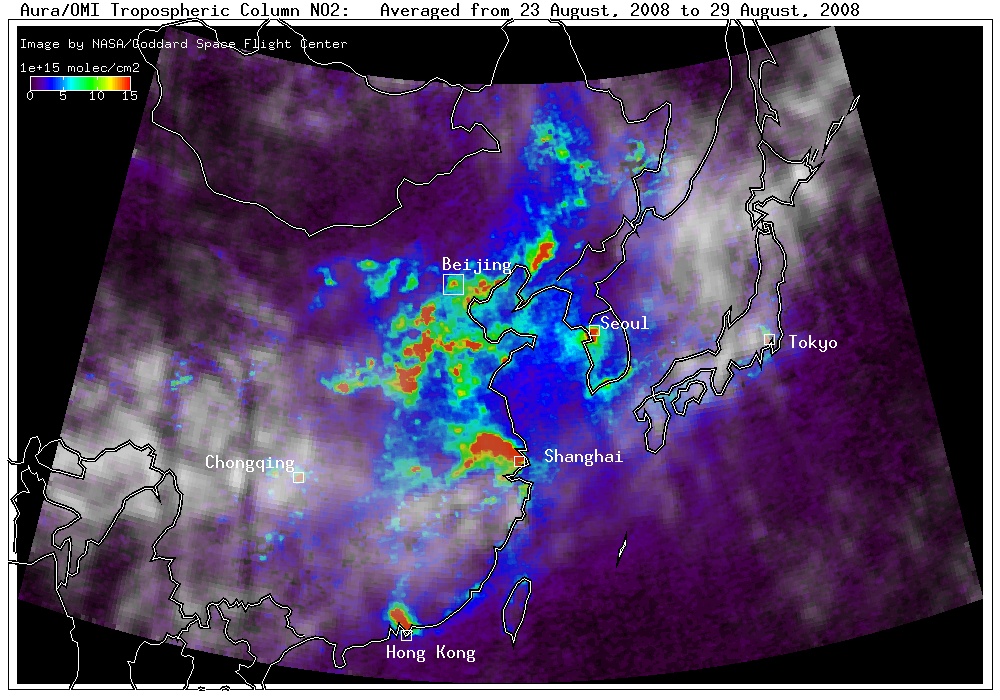
In the colored map above, most of the NO2 reduction is outside (east) of the little square indicating Bejing. (Clouds are white)
Aura's OMI (Ozone Monitoring Instrument) makes daily measurements of the total column of sulfur dioxide (SO2) and nitrogen dioxide (NO2). Volcanic eruptions can produce large amounts of SO2. Formaldehyde (HCHO) is a volatile hydrocarbon which reacts with NO2 to form ozone.
Comparable large values of SO2 are found when high sulfur coal is used in power plants. Nitrogen dioxide is a product of high temperature combustion. Cars, trucks and buses all emit NO2, and OMI NO2 measurements show high values in cities and along heavily used highways. Power plants also emit NO2. OMI measures these gases over the sunlit part of the Earth every day.
The Chinese government placed restrictions on traffic and power plants to improve air quality in Beijing during the Olympics. OMI measurements show how successful these efforts have been by comparing the SO2 and NO2 values for this year with measurements in 2006 and 2007 without the restrictions.
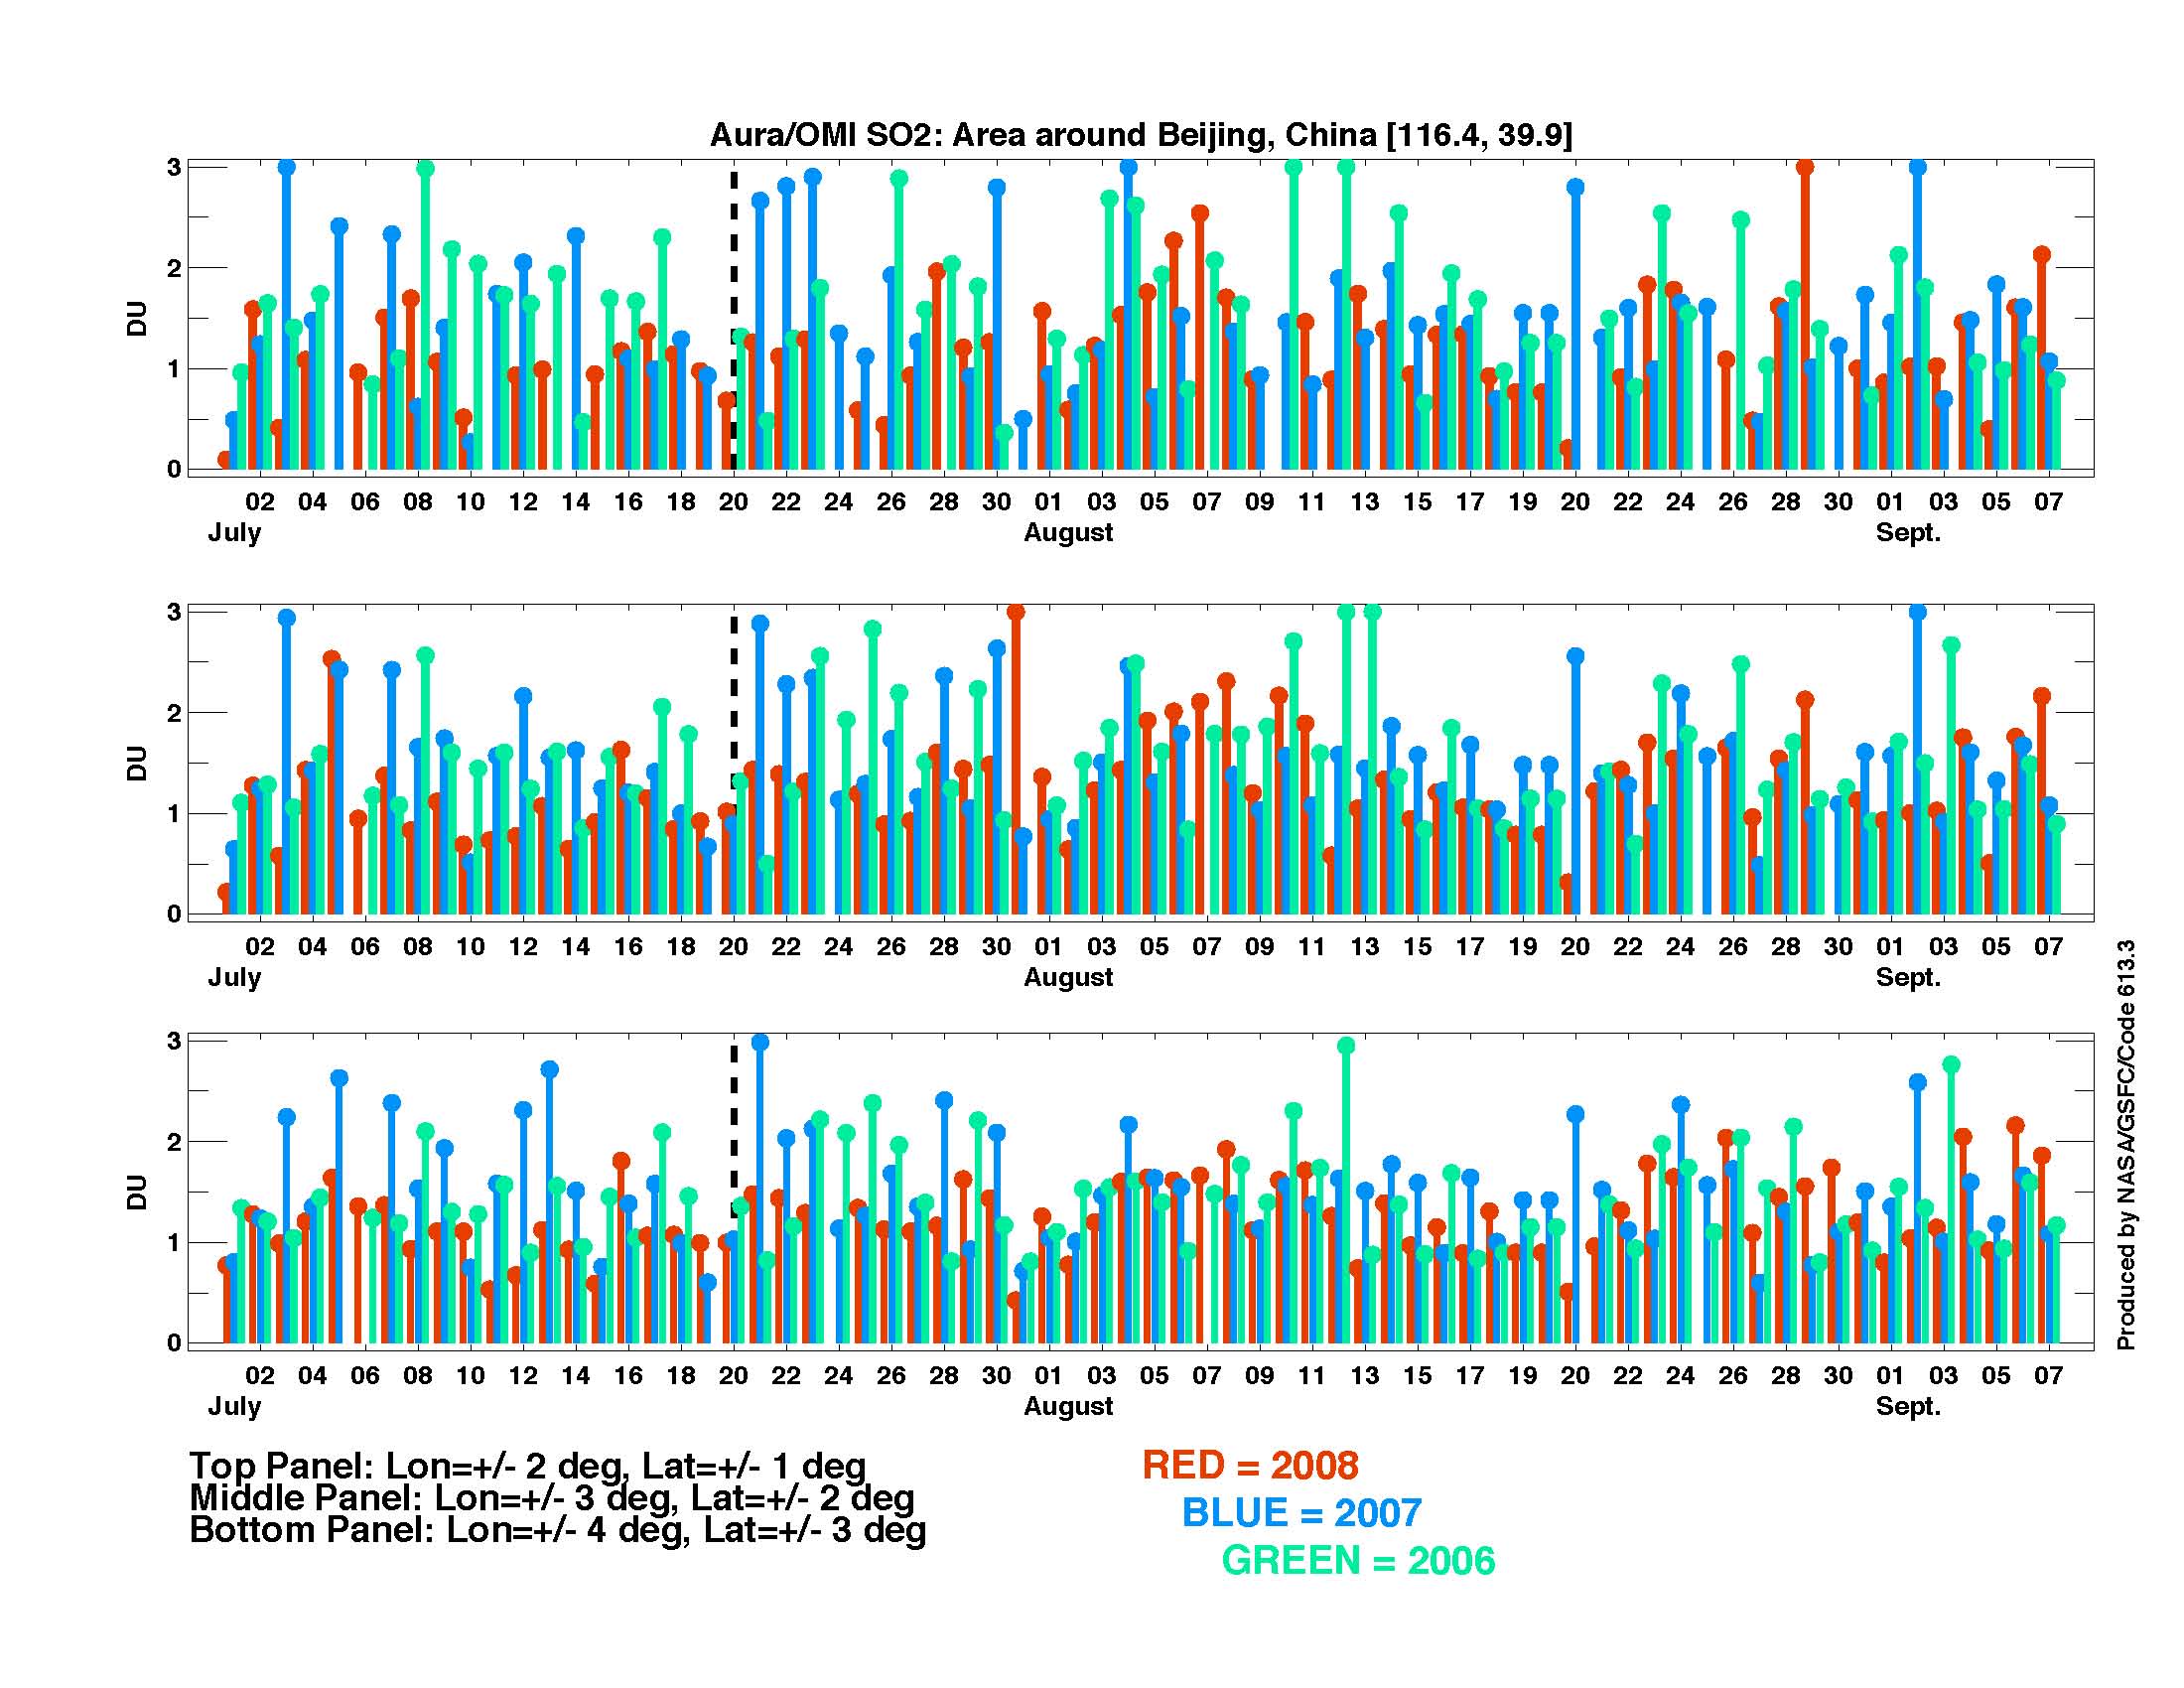
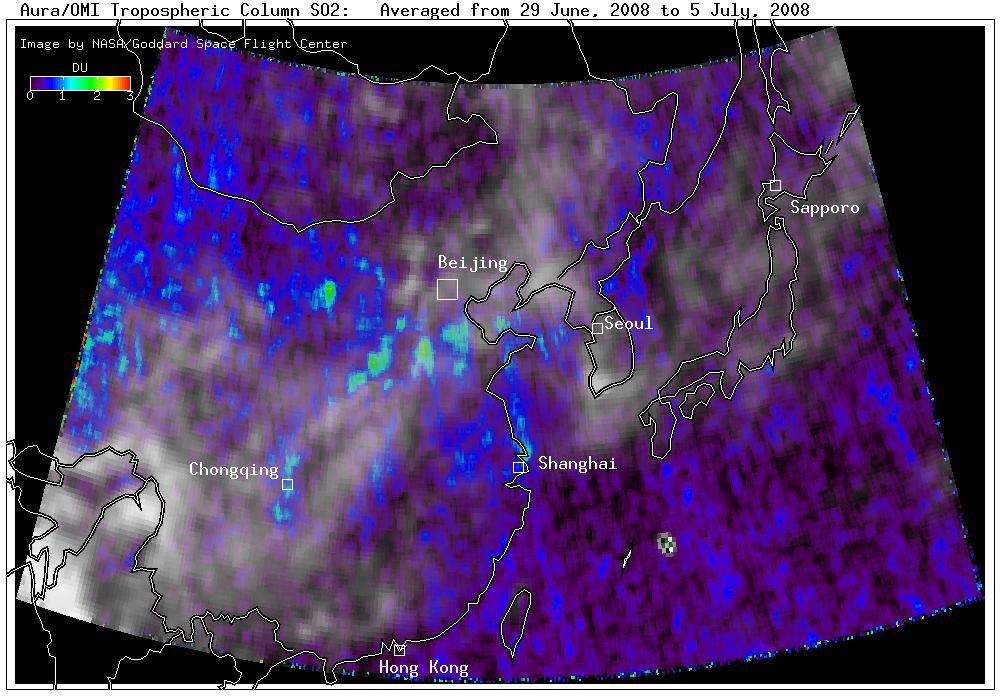
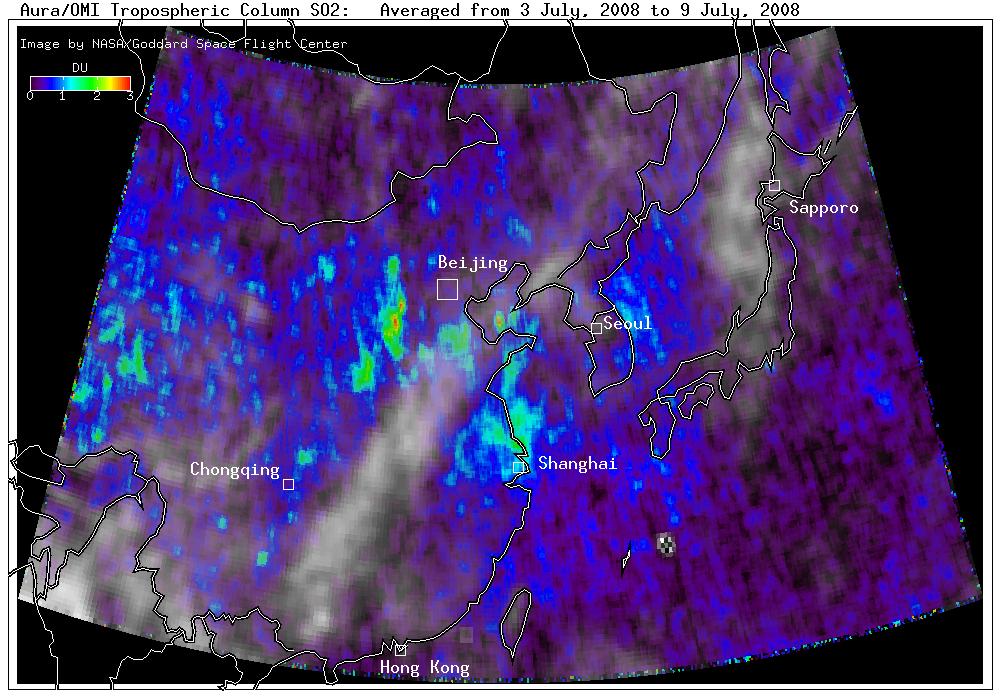
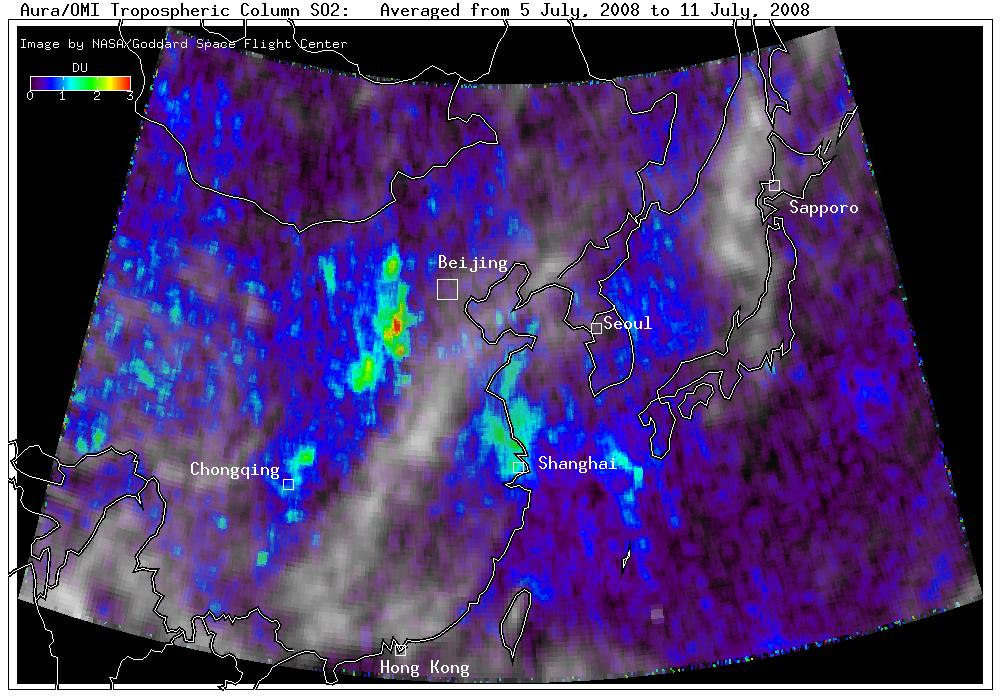
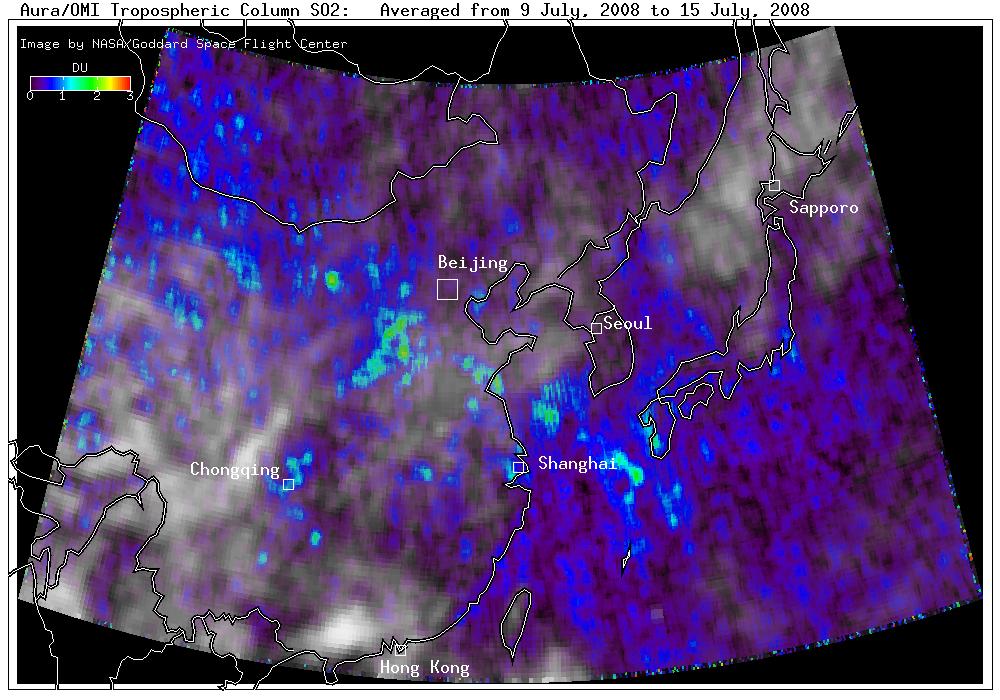
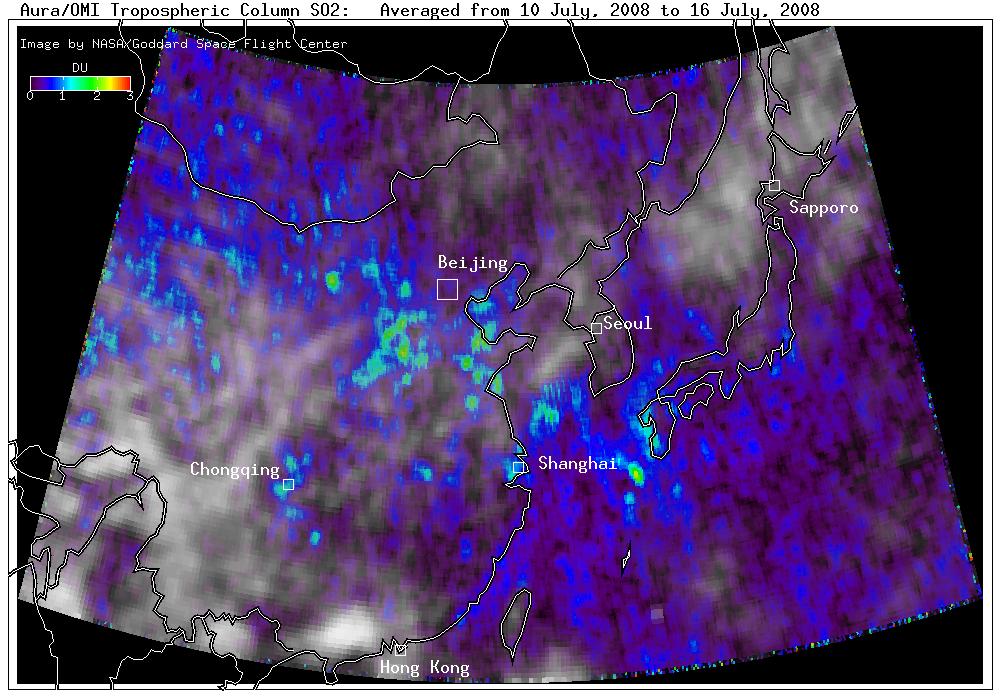
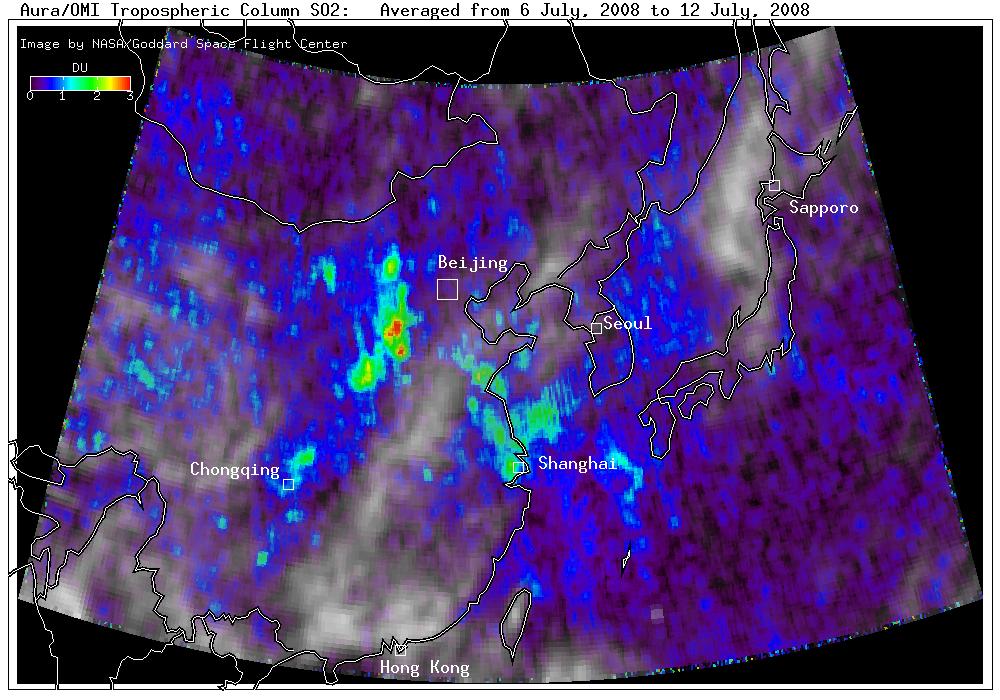
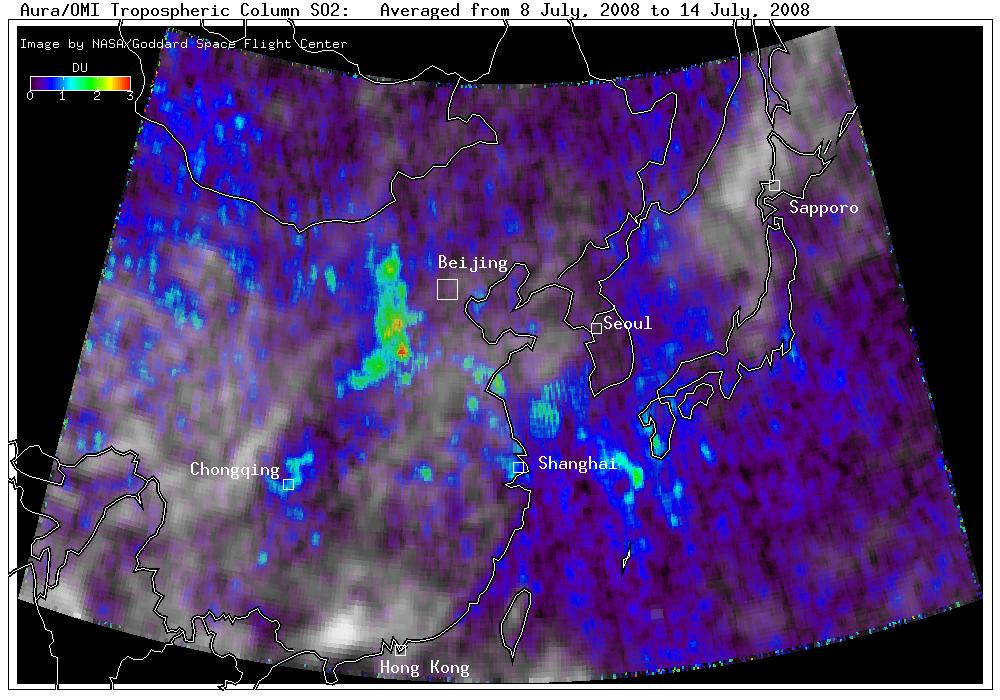
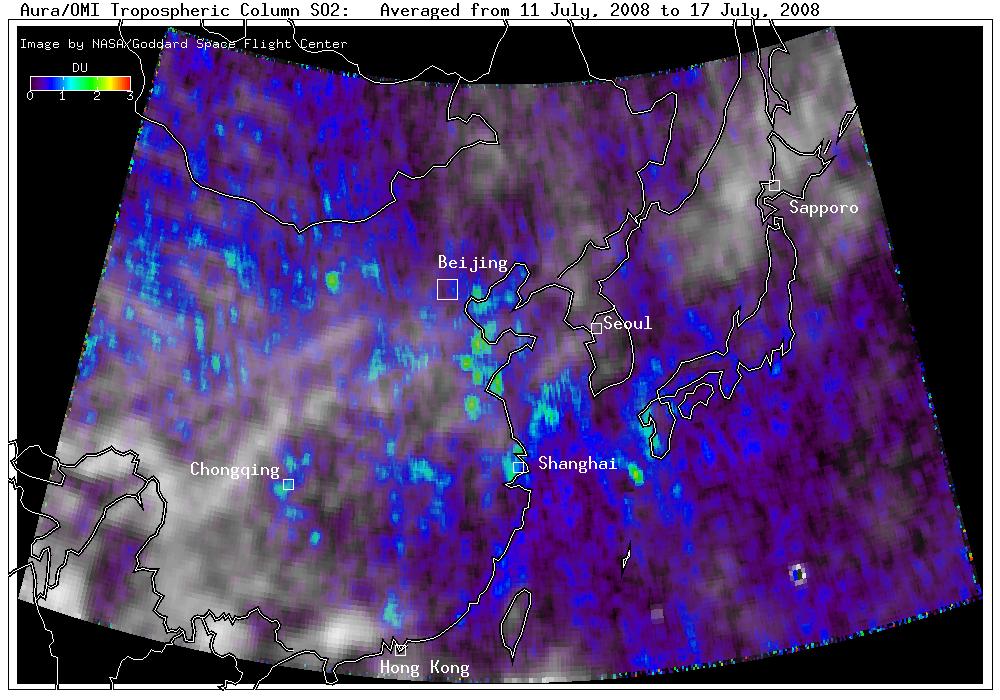
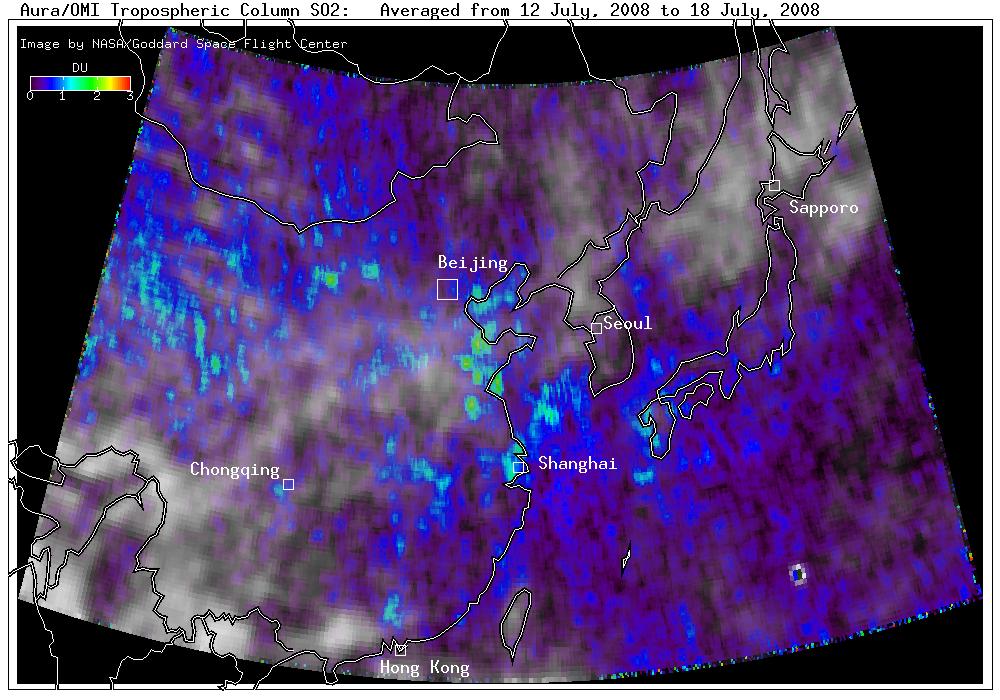
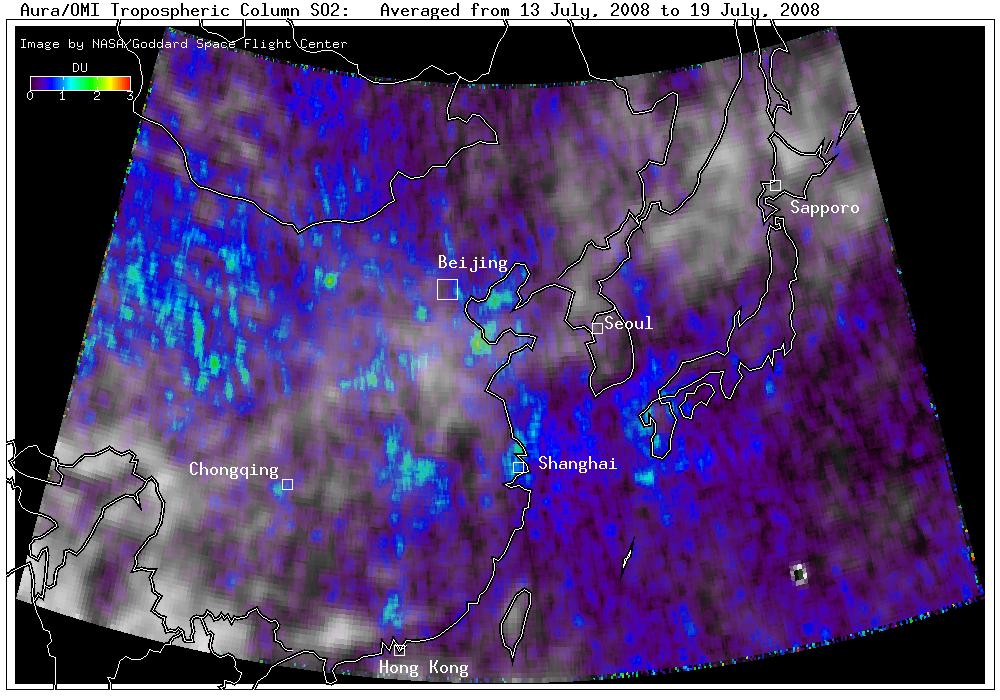
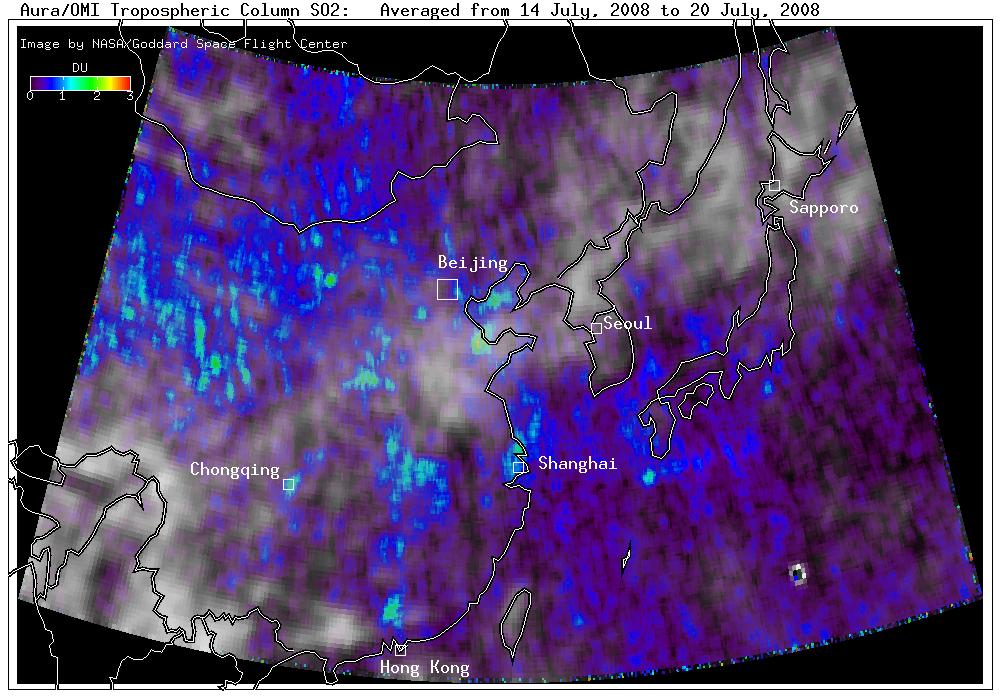
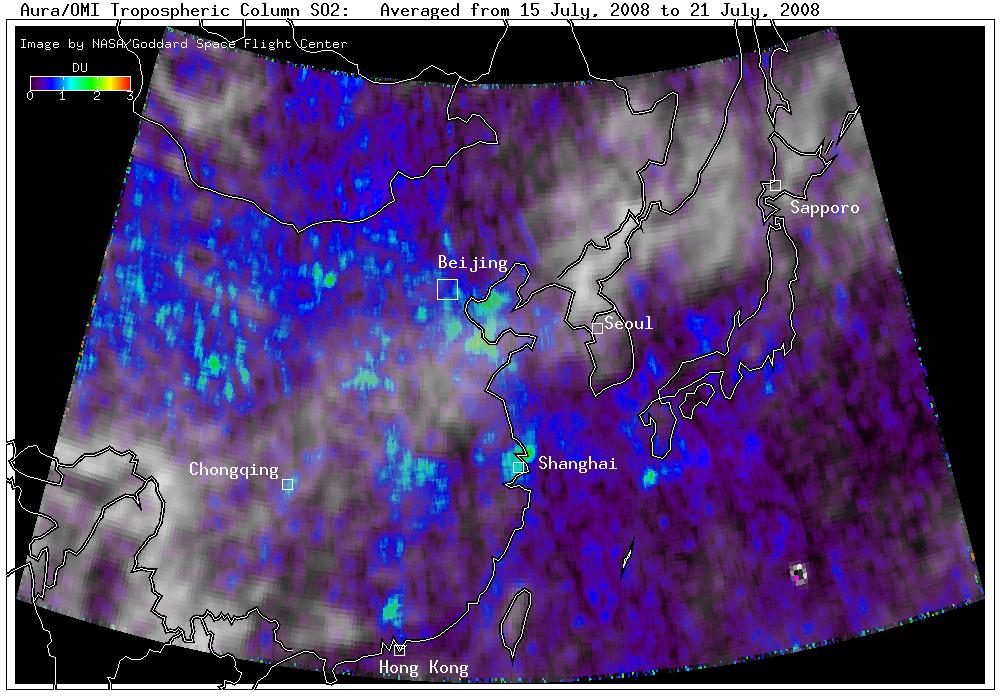
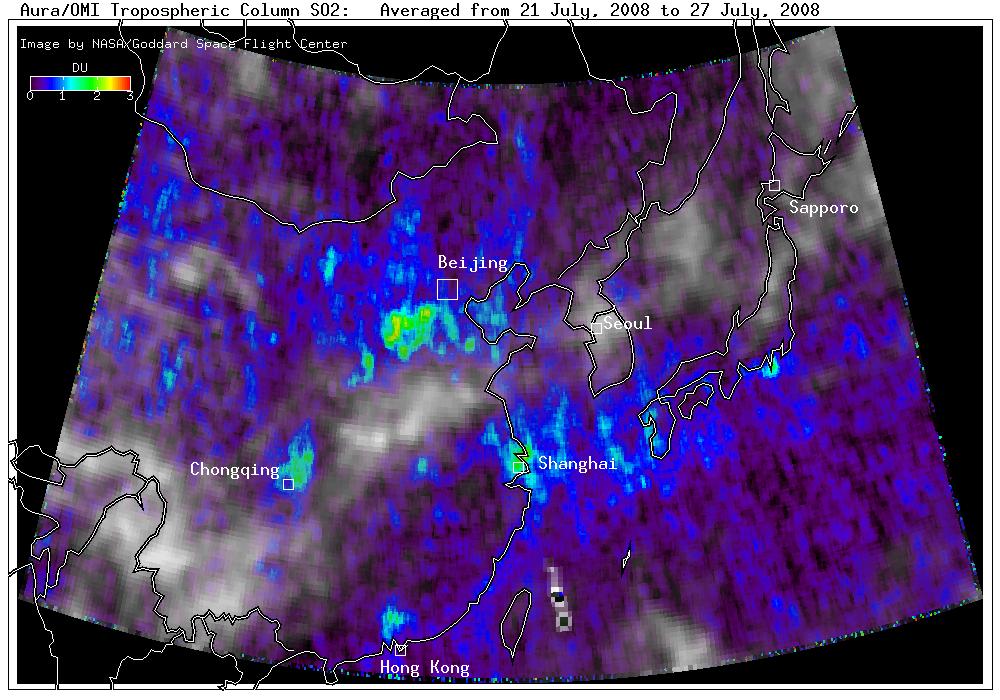
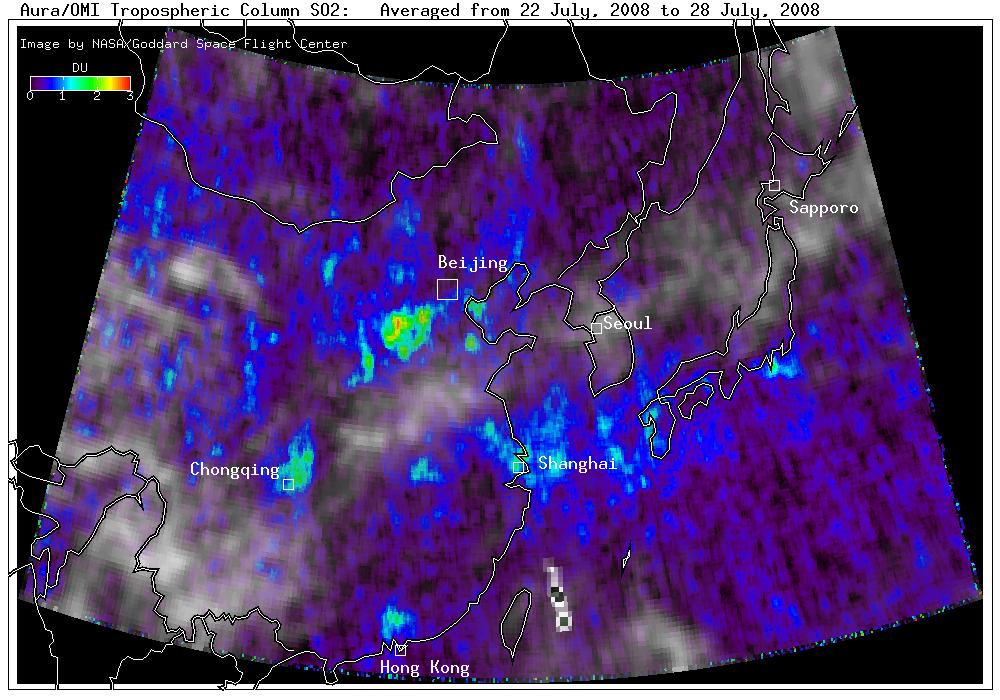
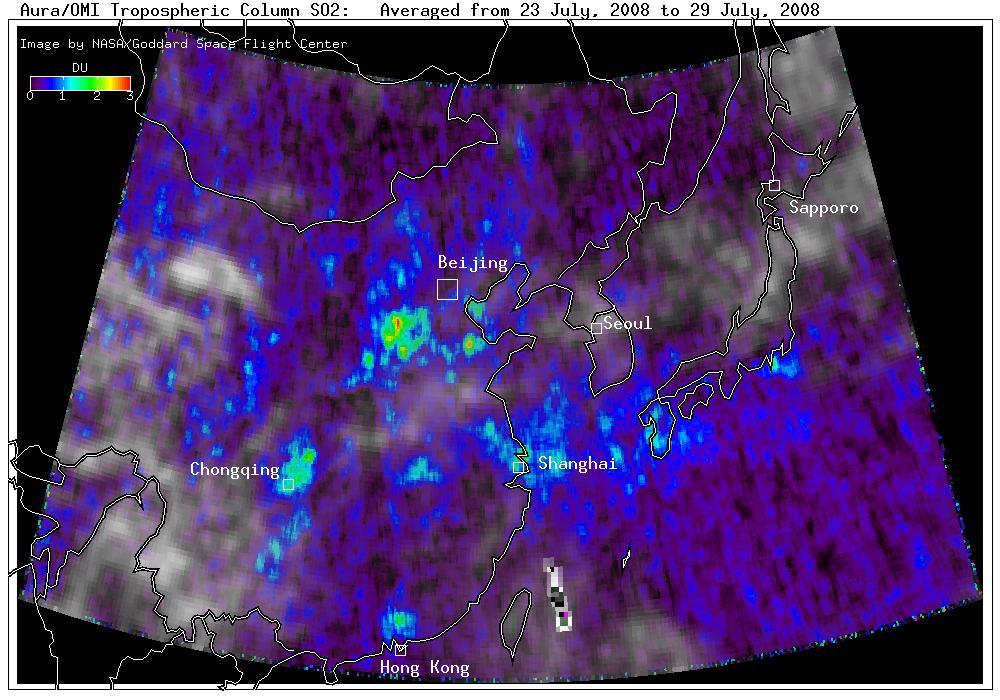
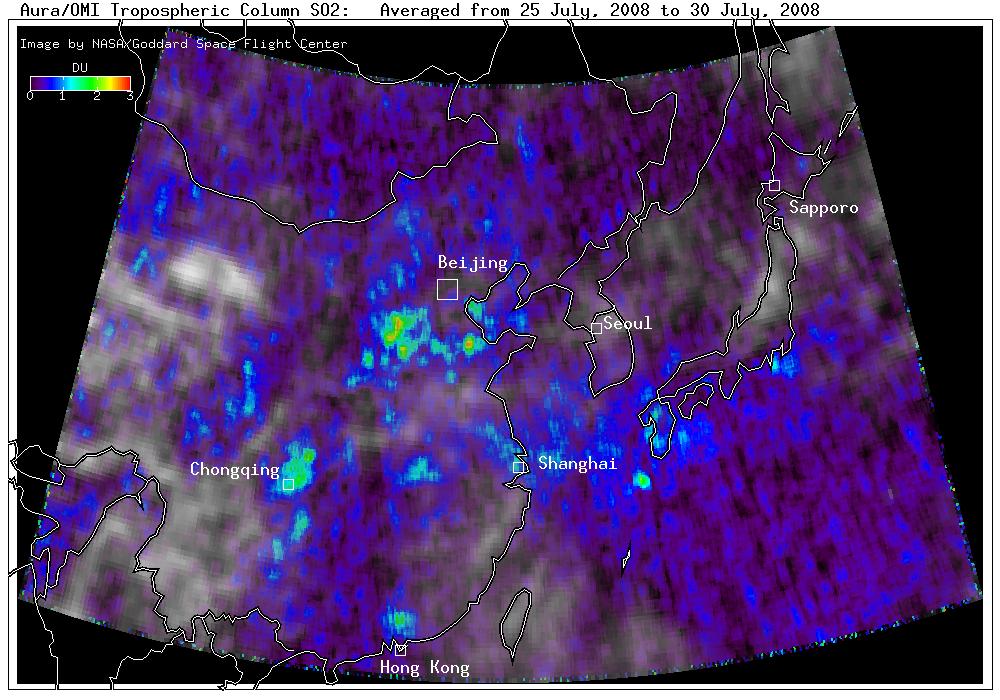
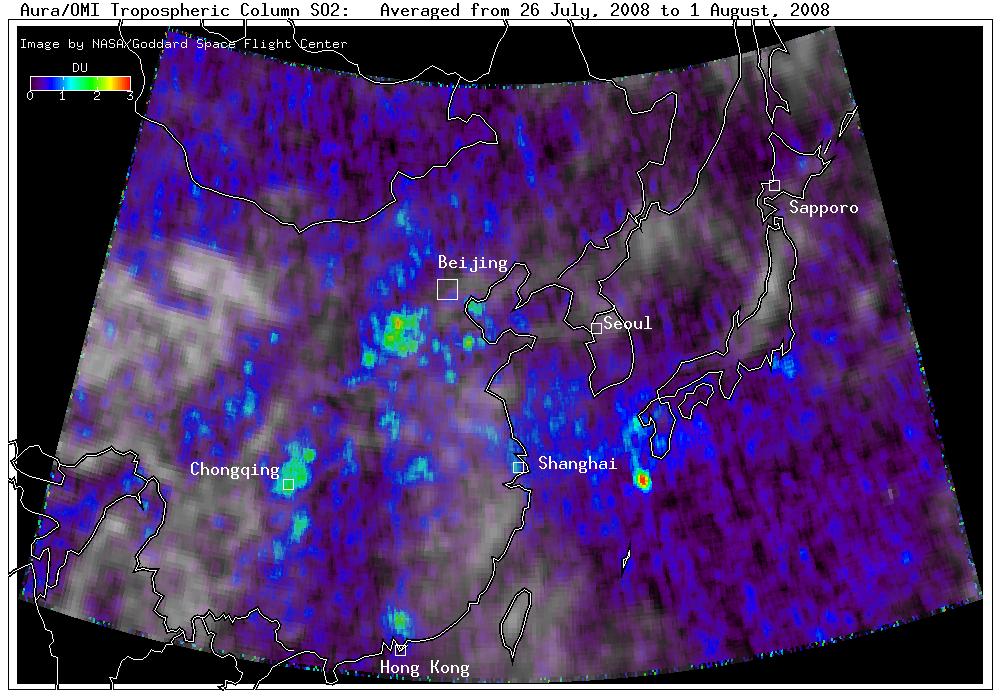
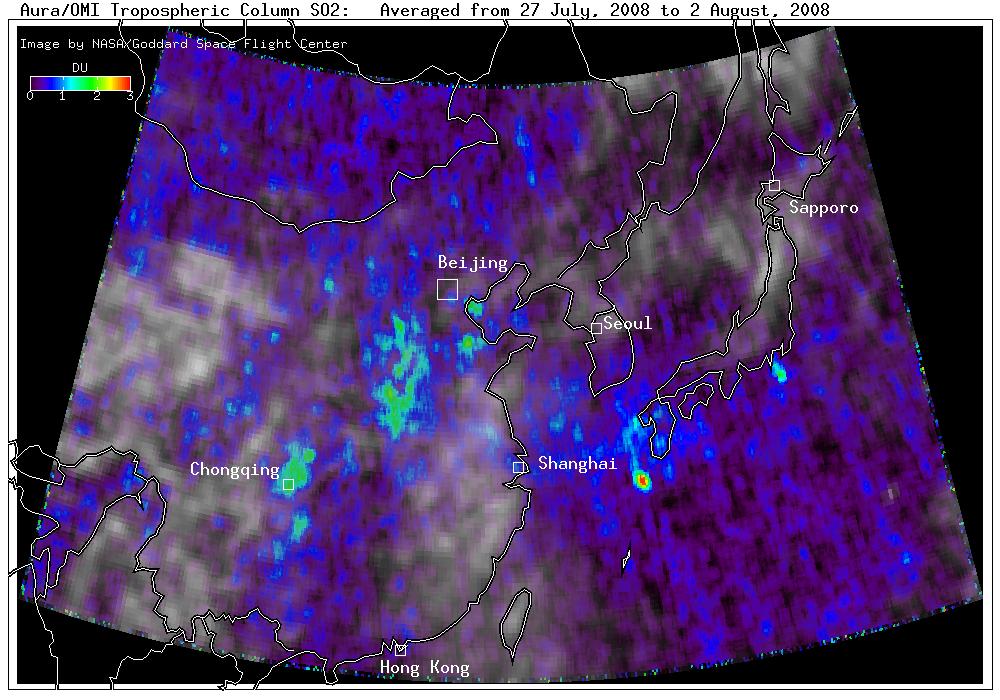
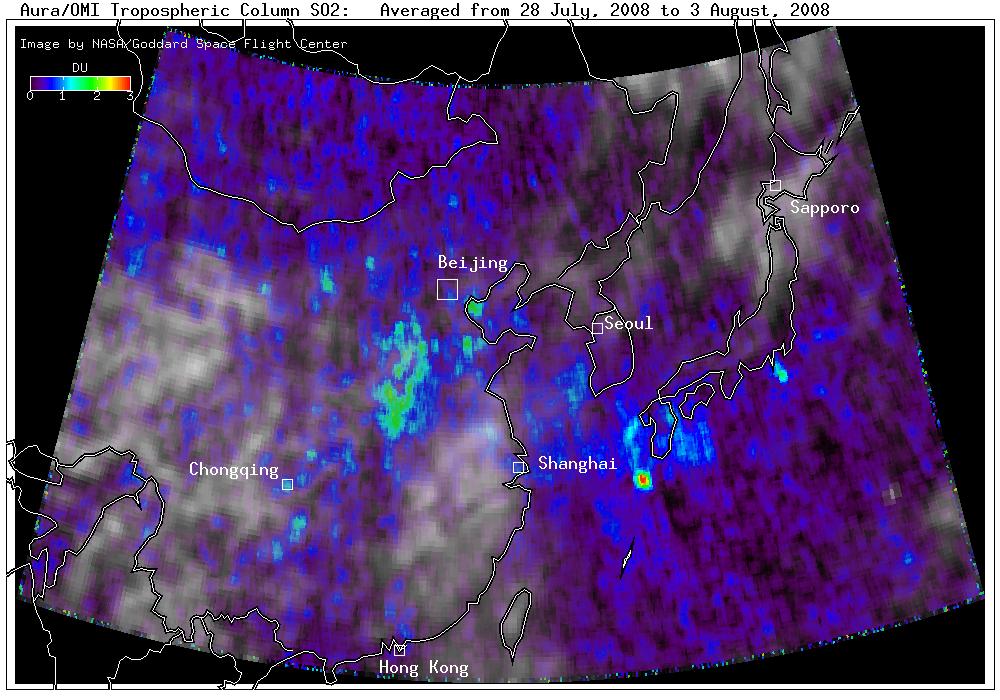
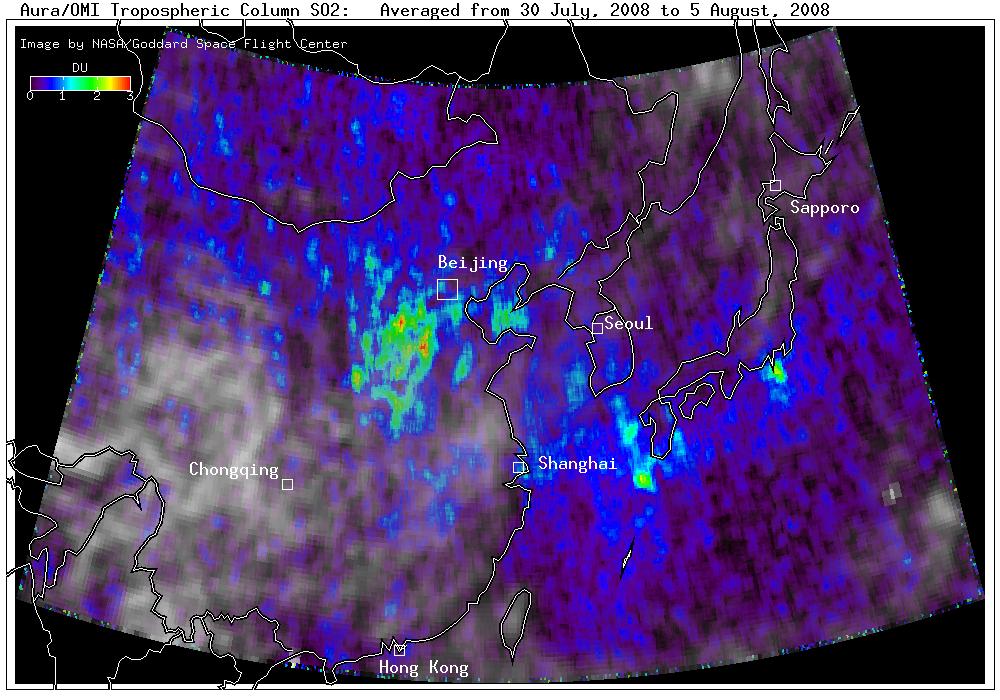
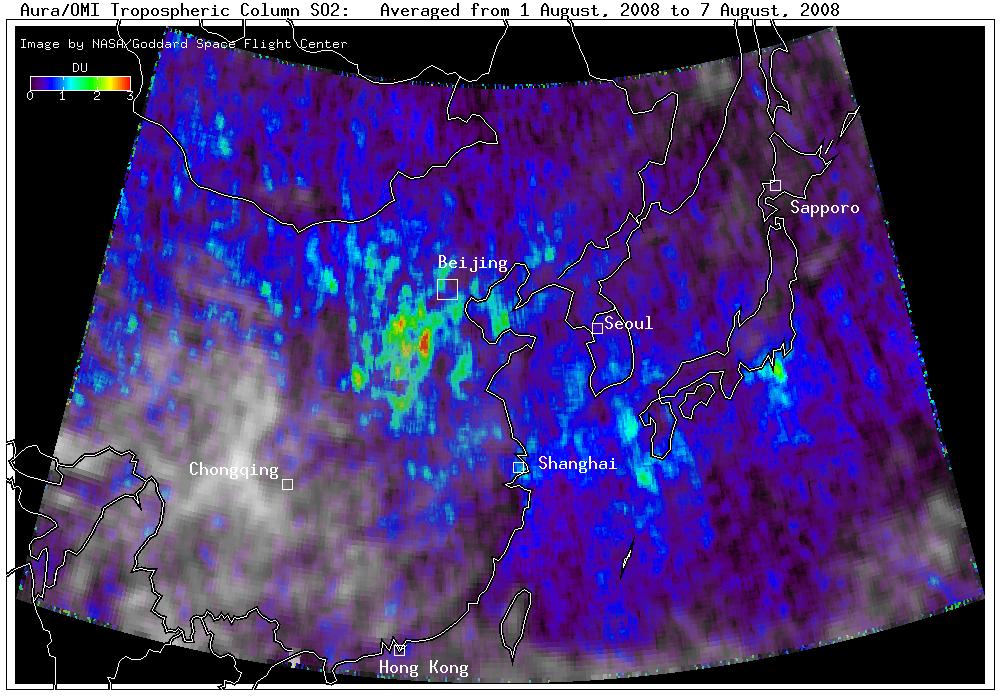
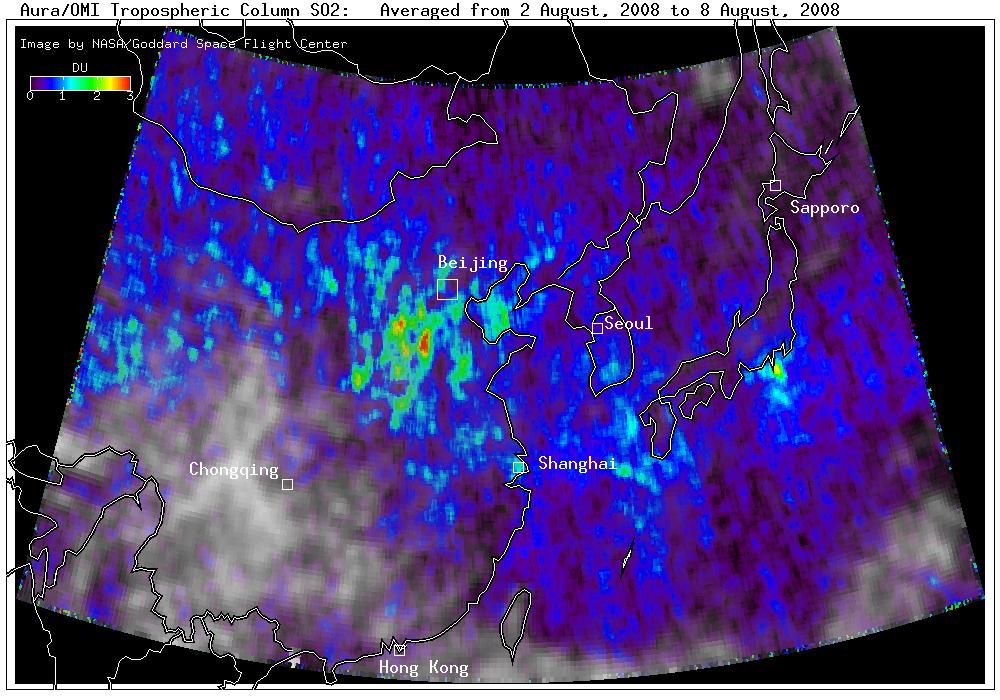
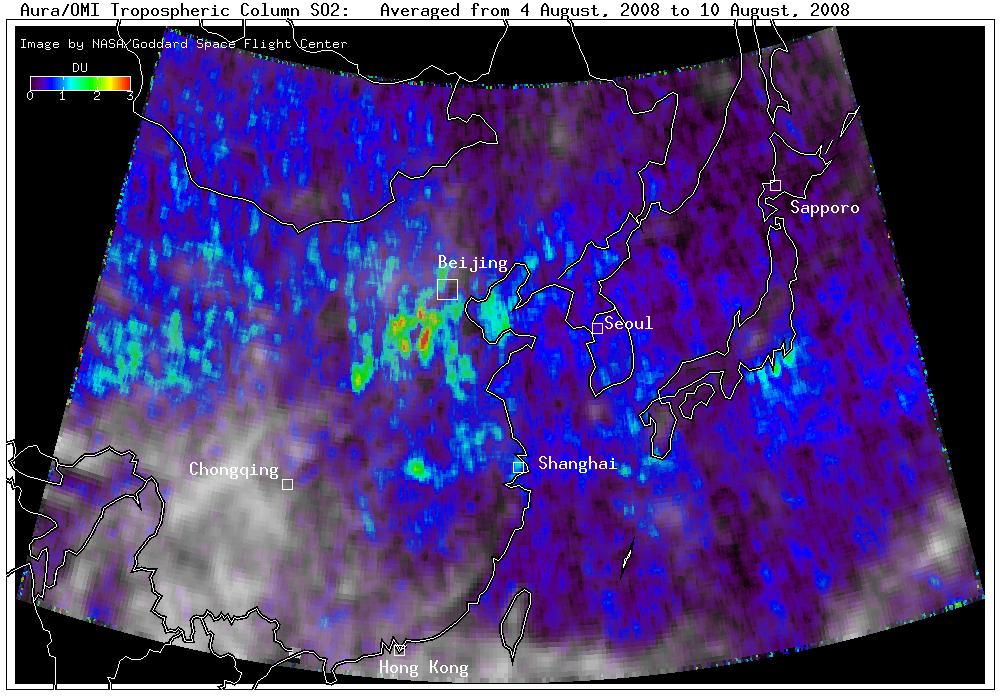
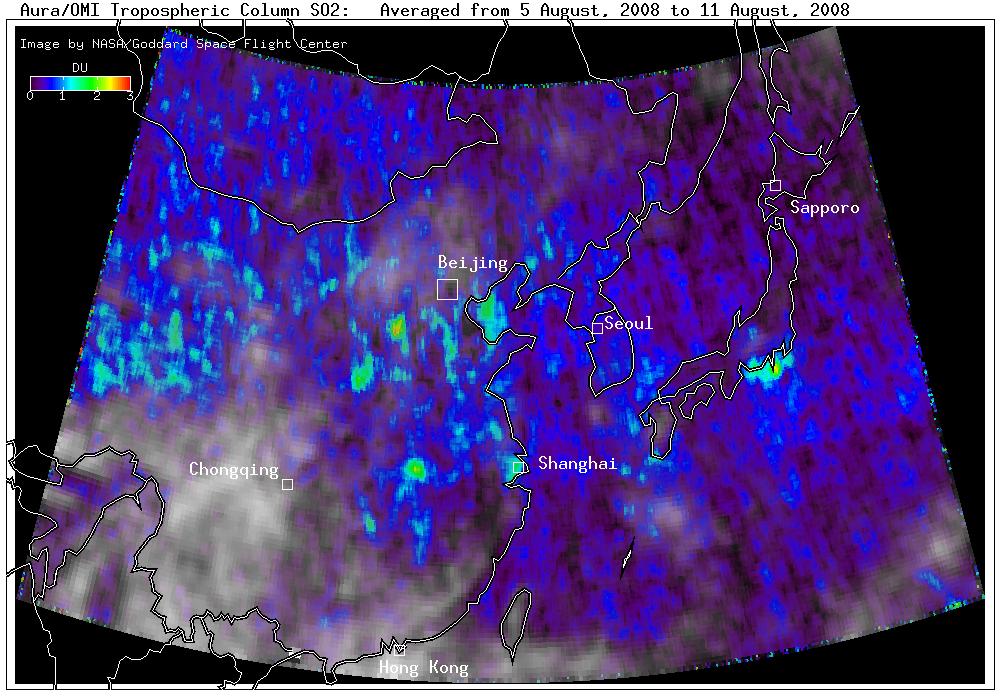
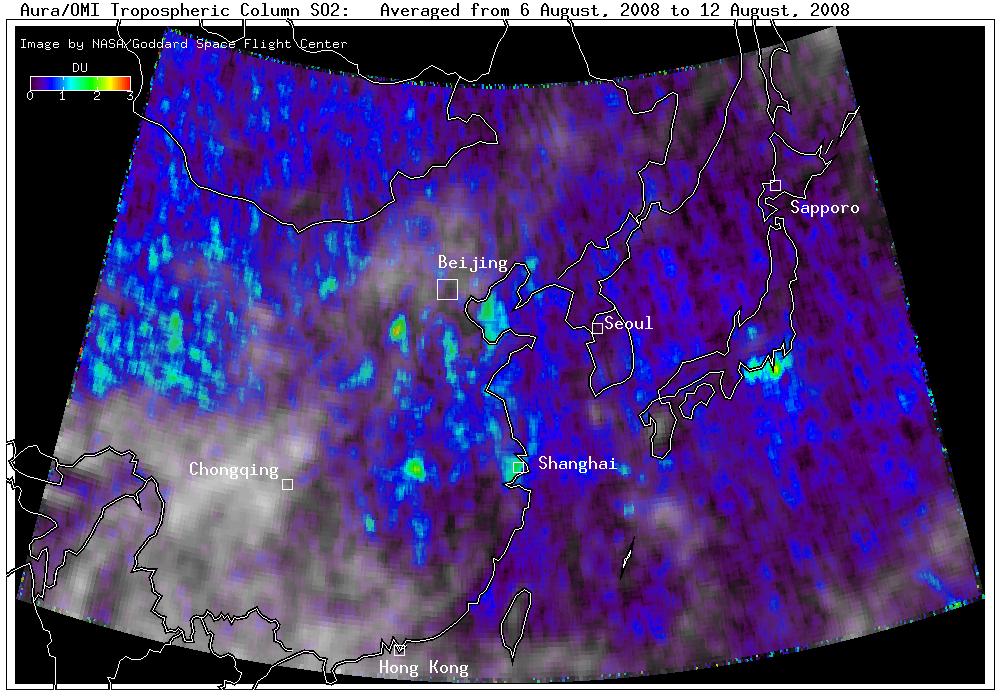
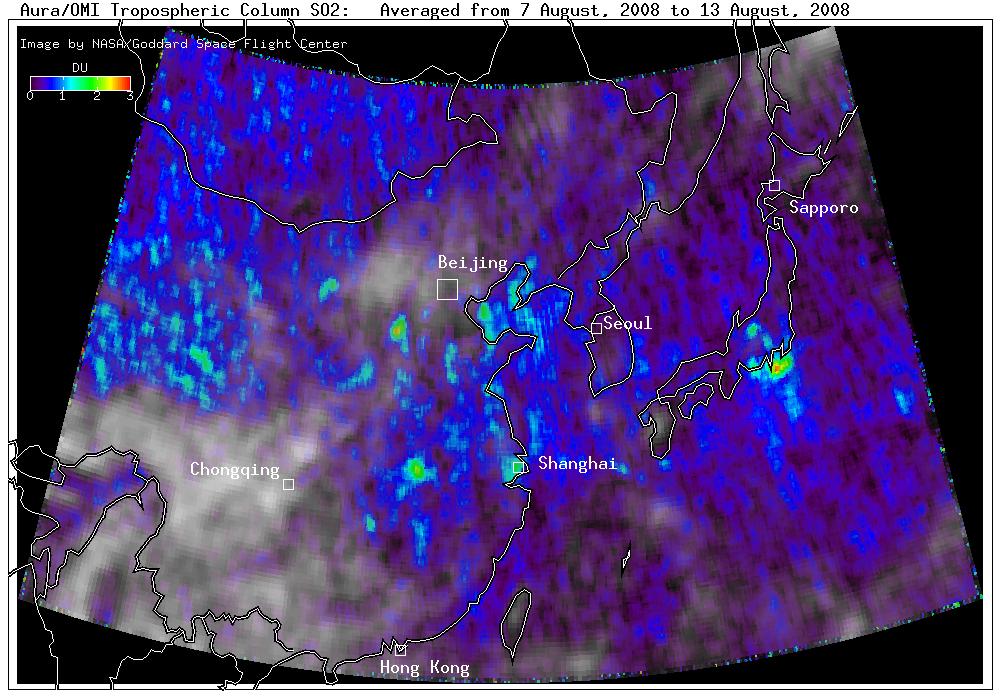
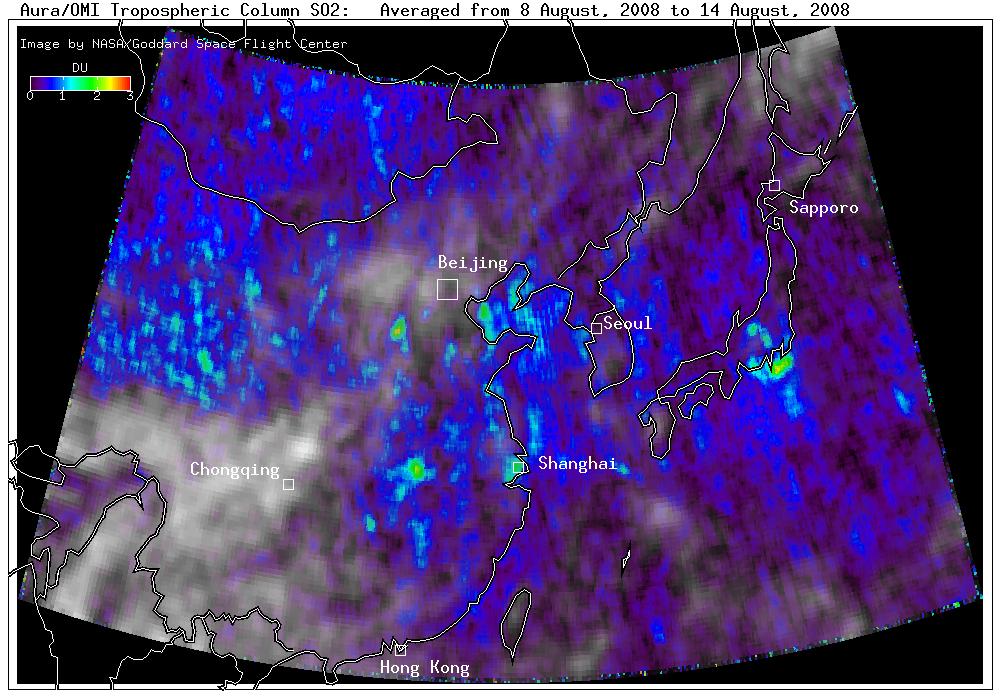
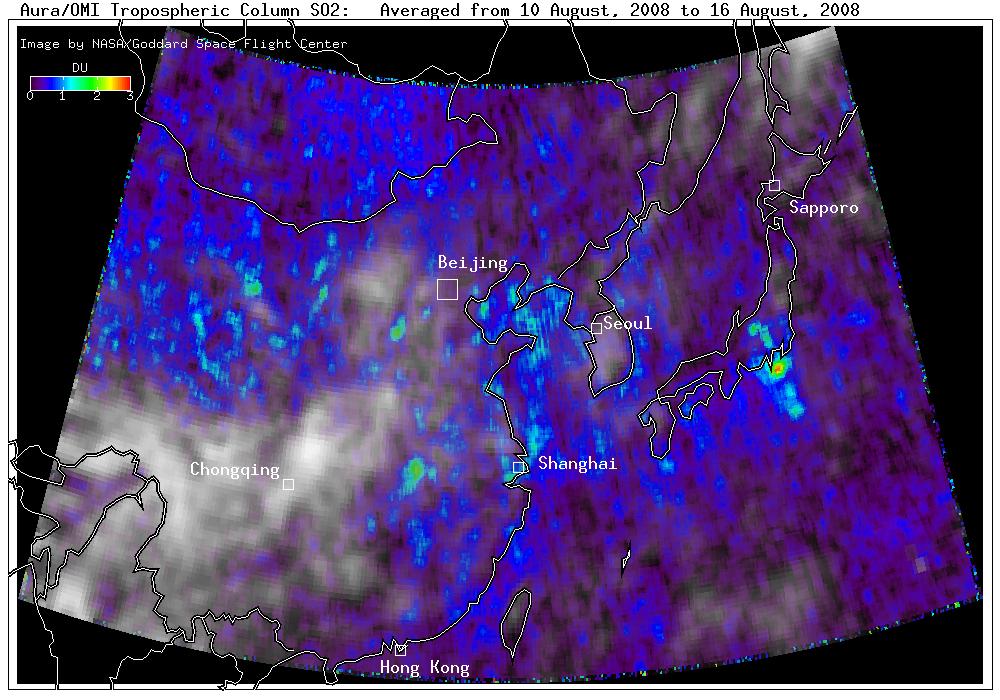
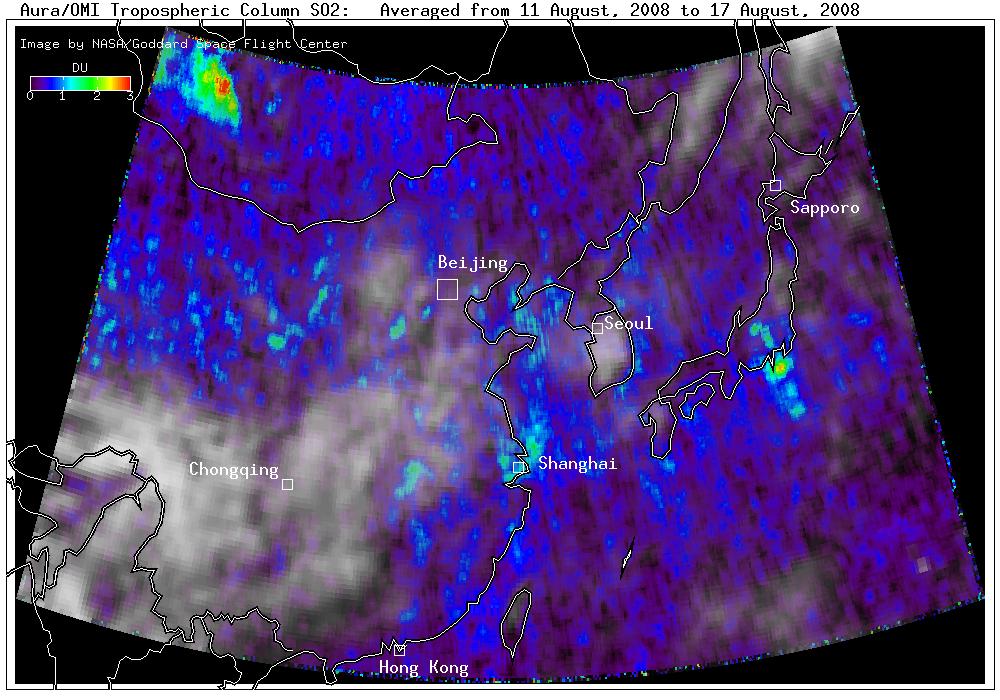
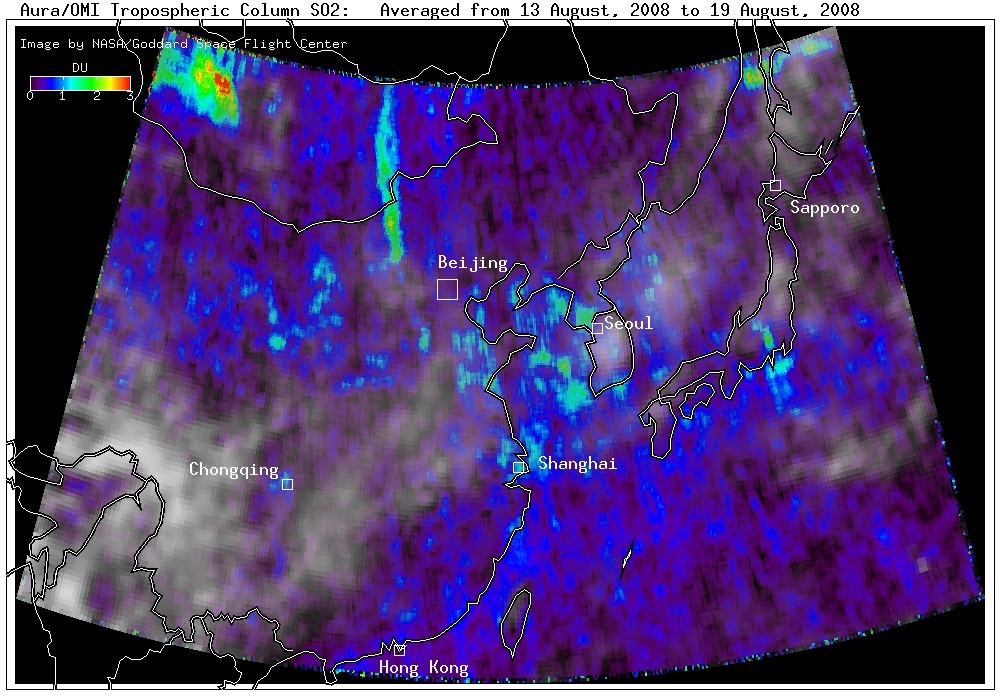
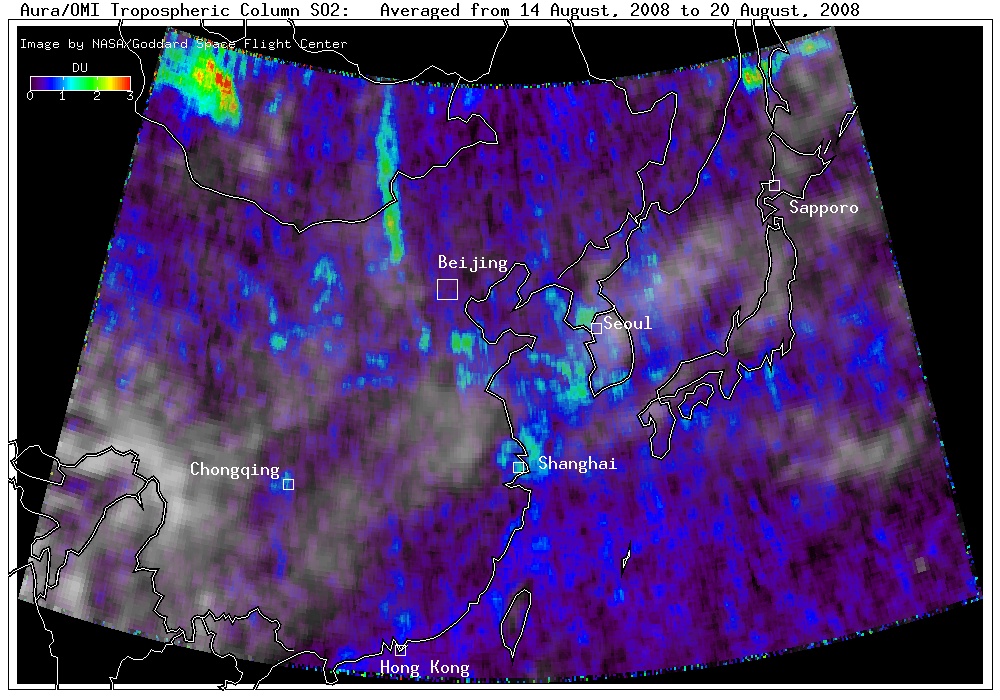
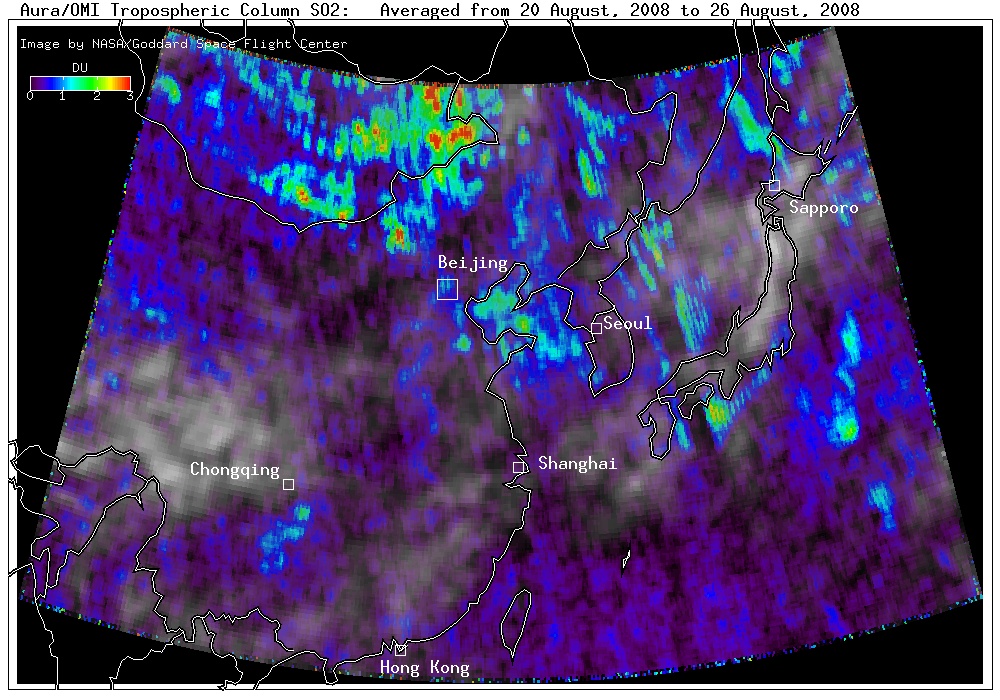
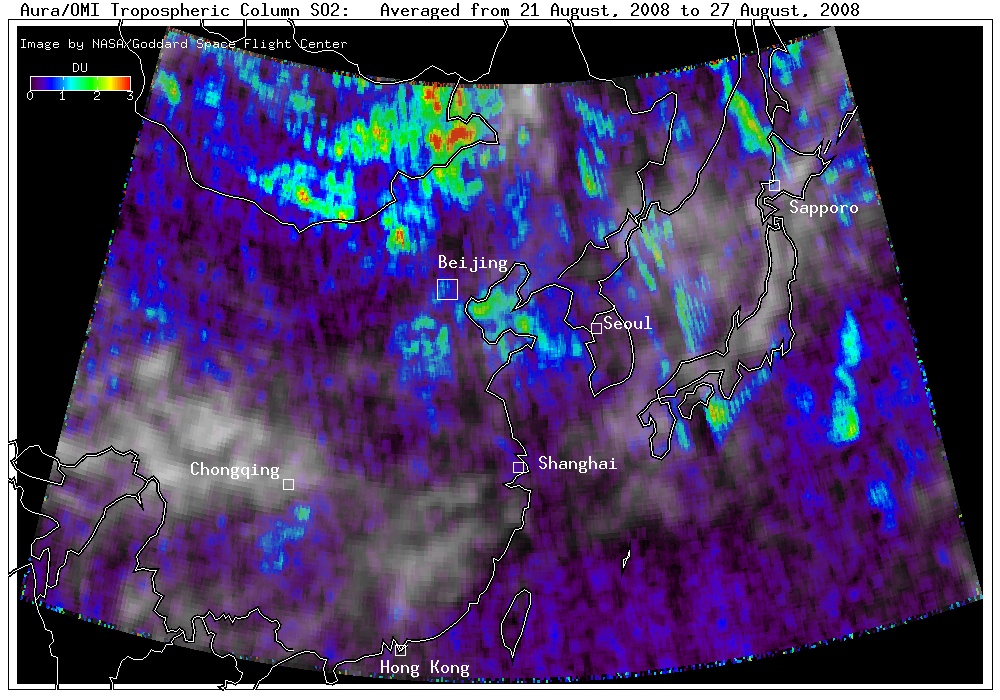
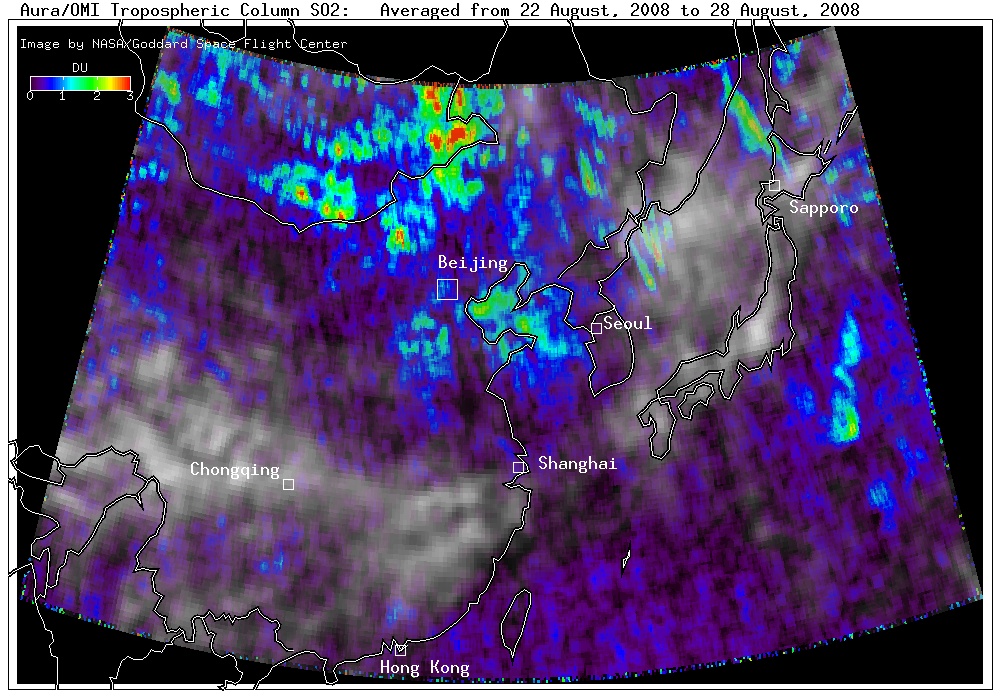
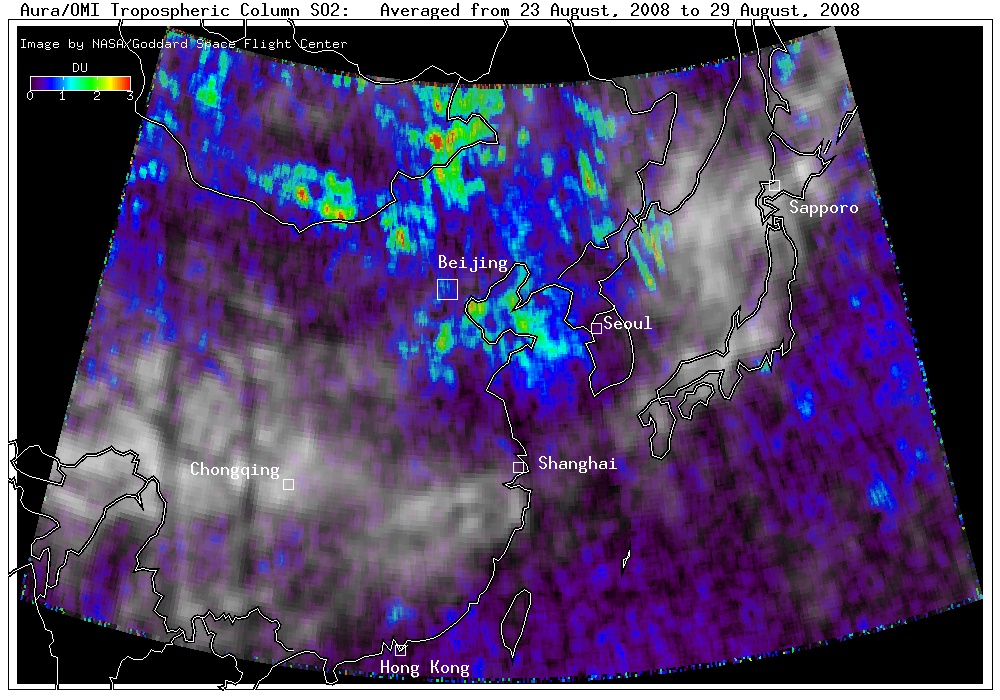
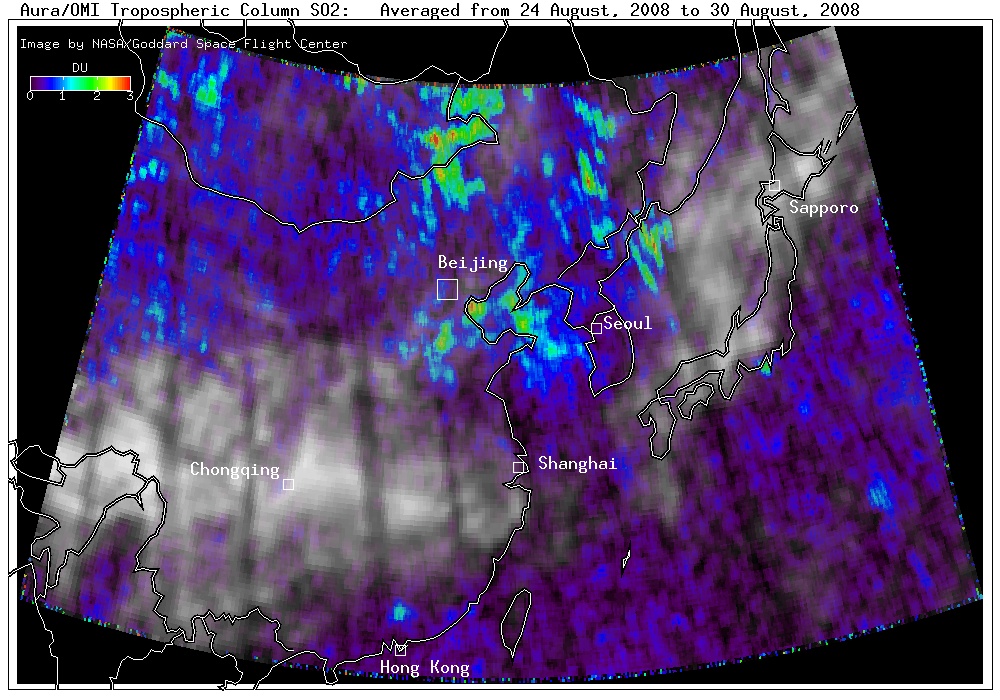
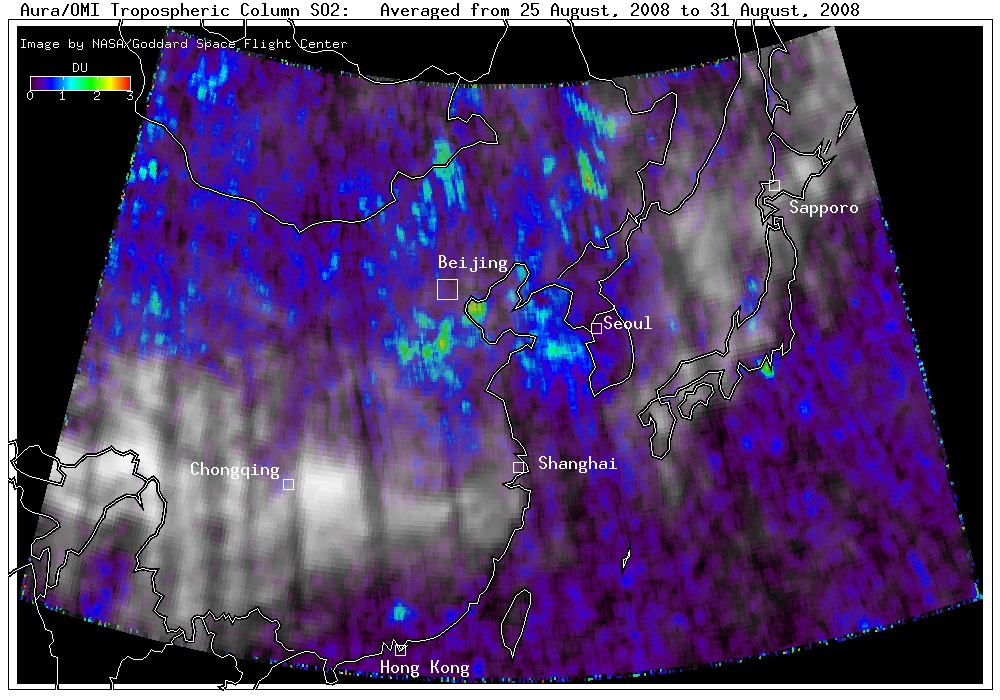
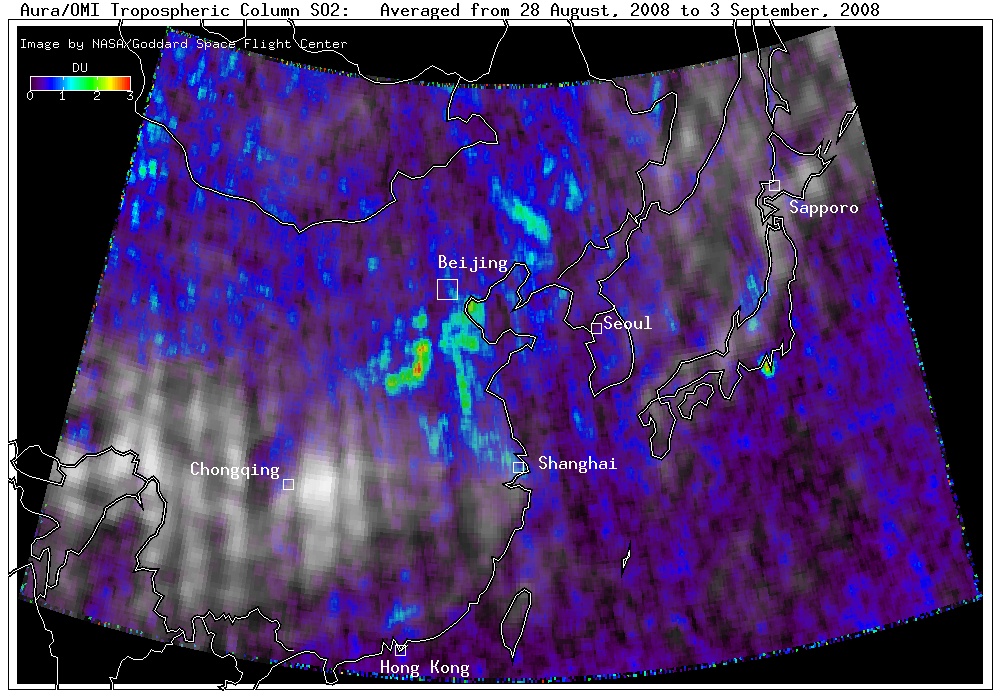
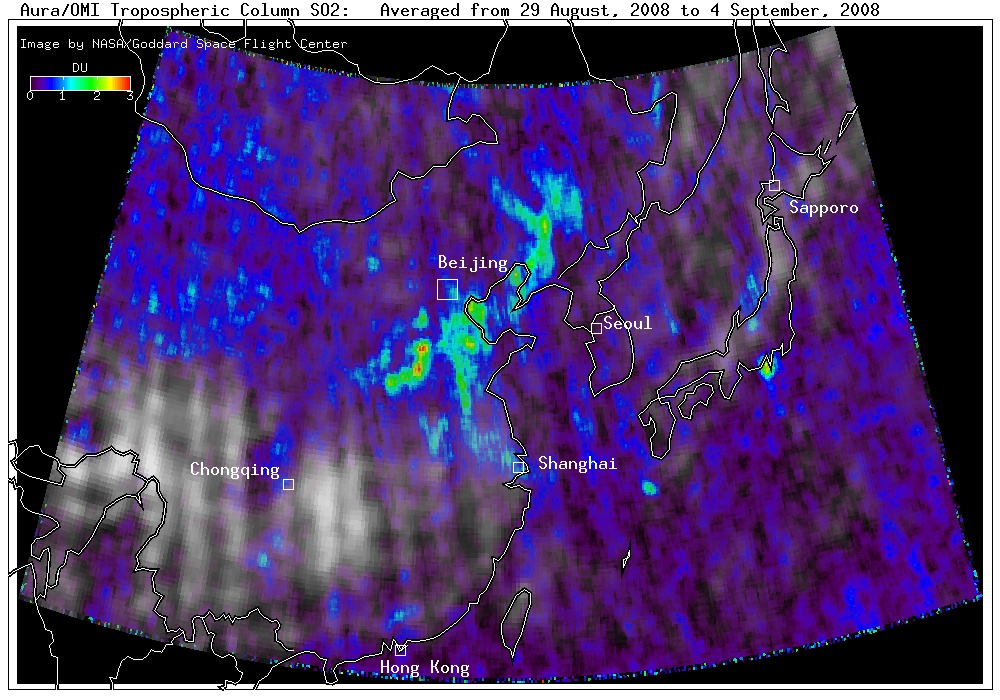
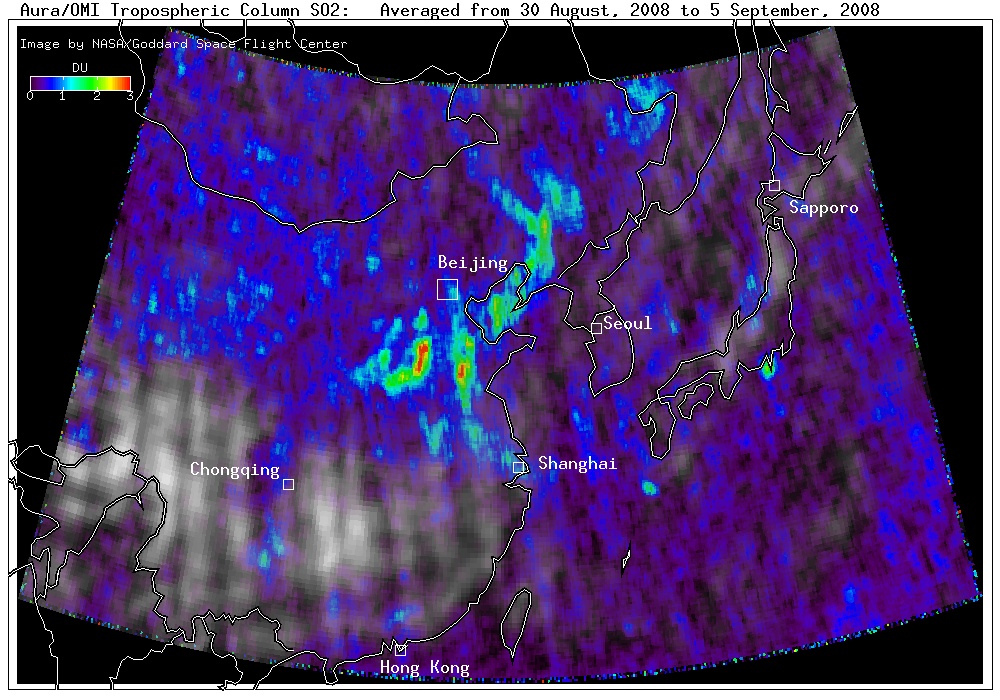
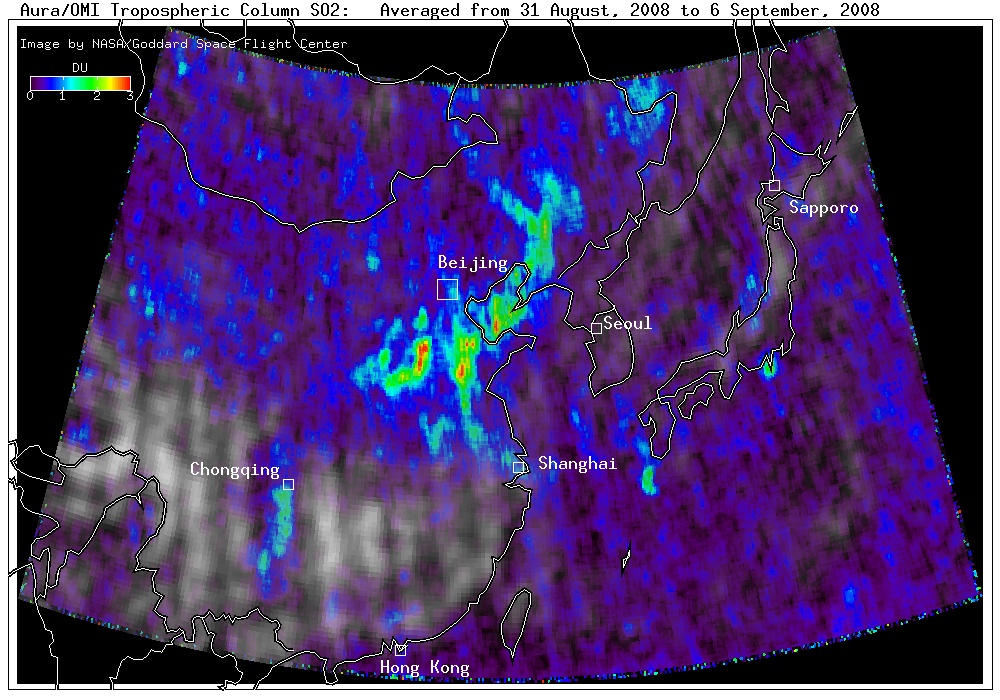
OMI boundary layer SO2 observations averaged averaged from July through August 2008. Highest SO2 is typically located to the south and southwest of Beijing in regions with large clusters of power plants.
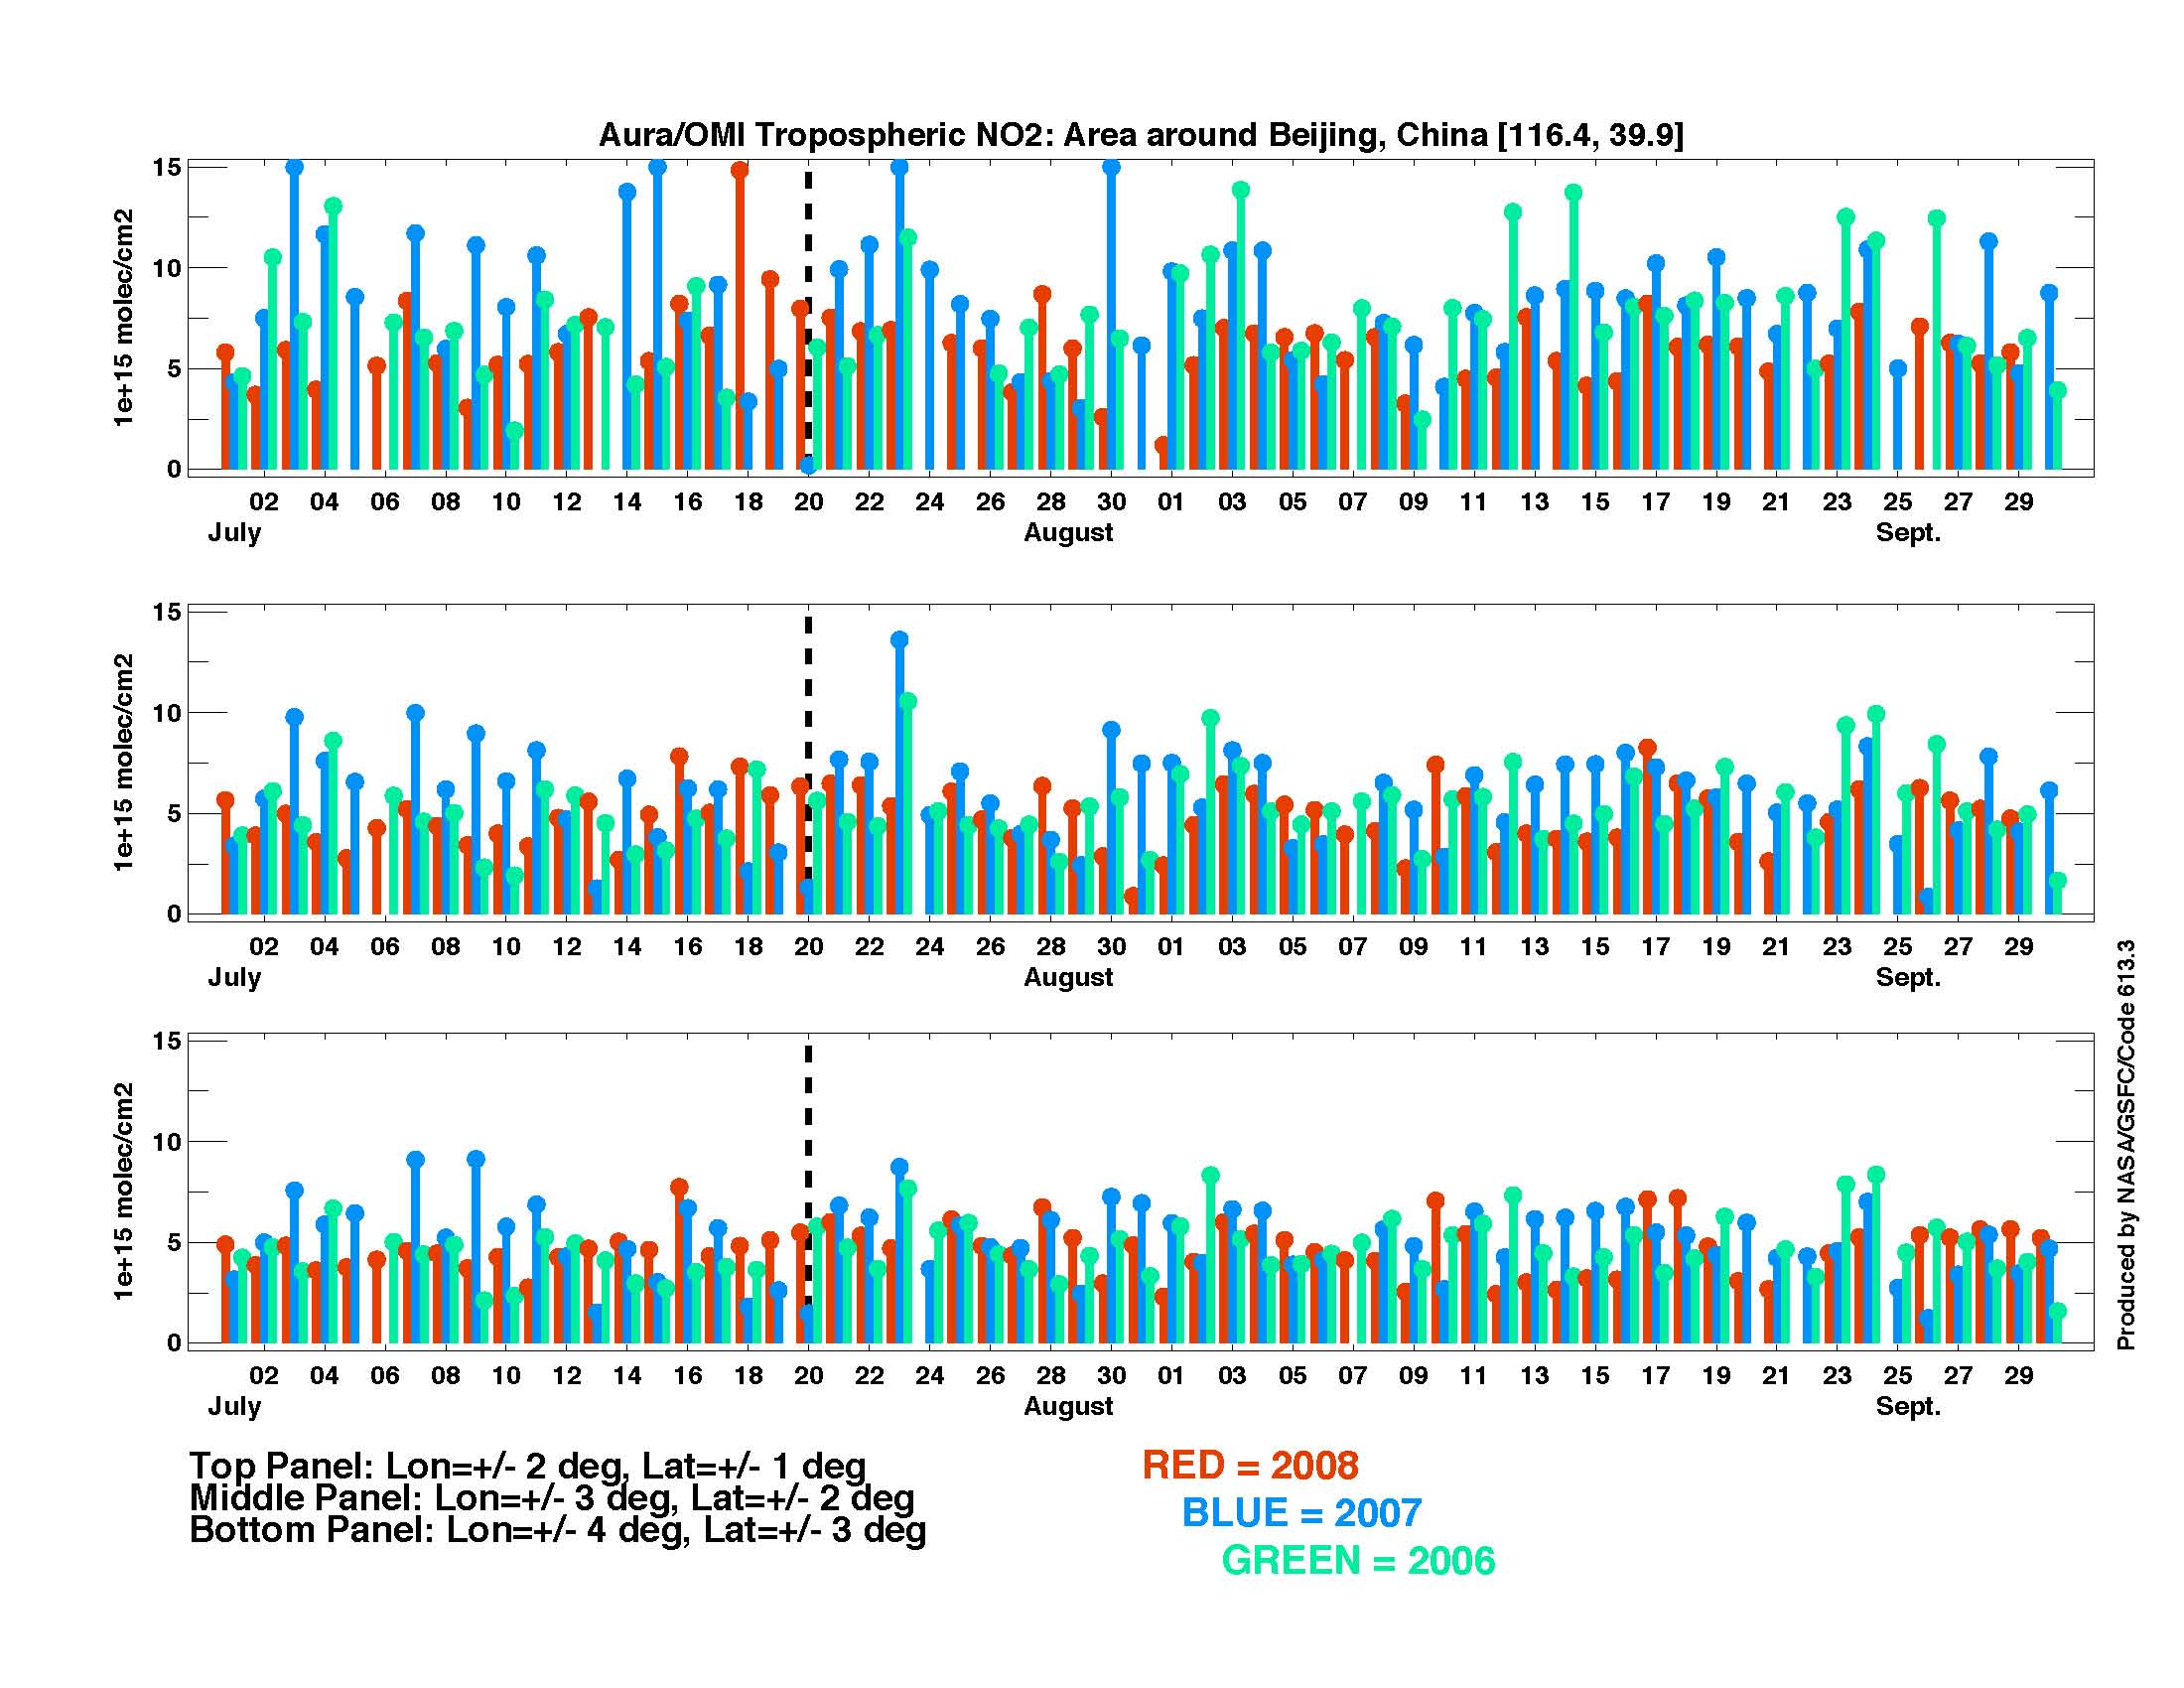
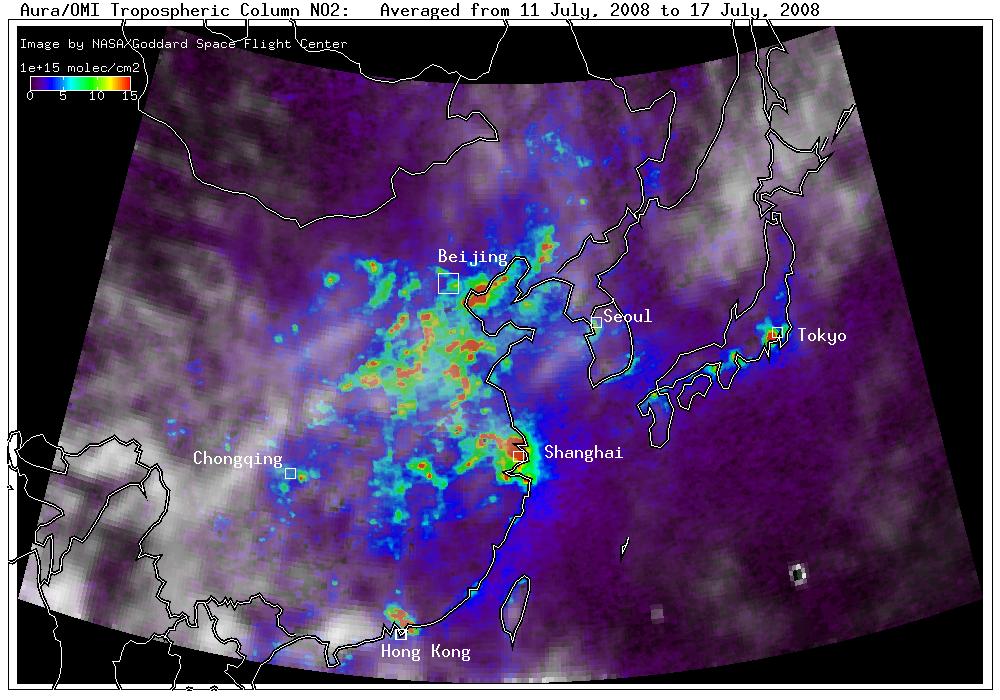
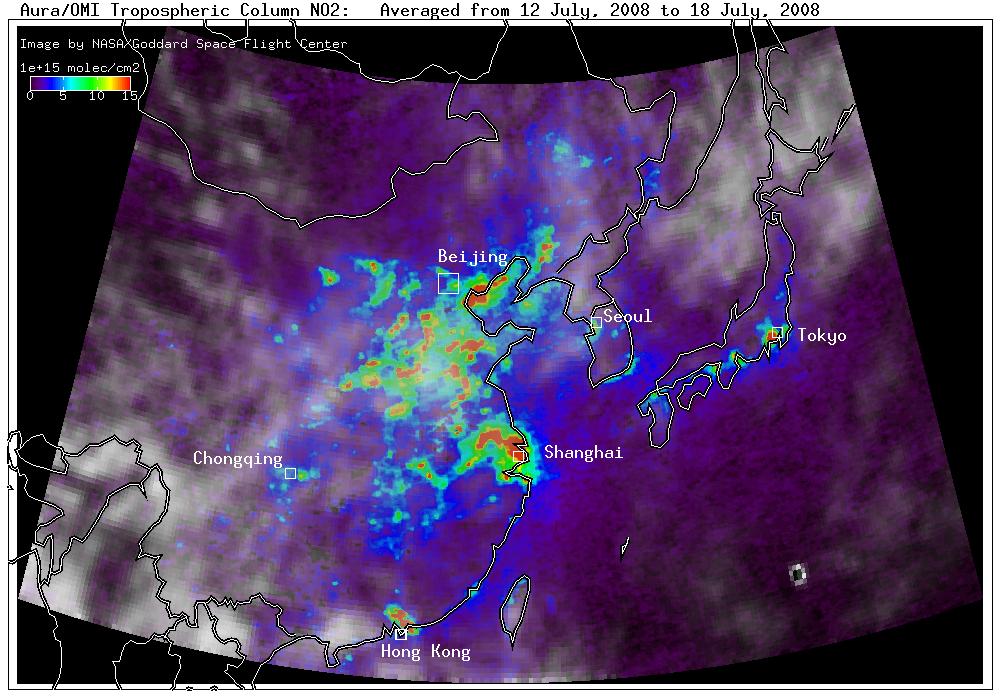
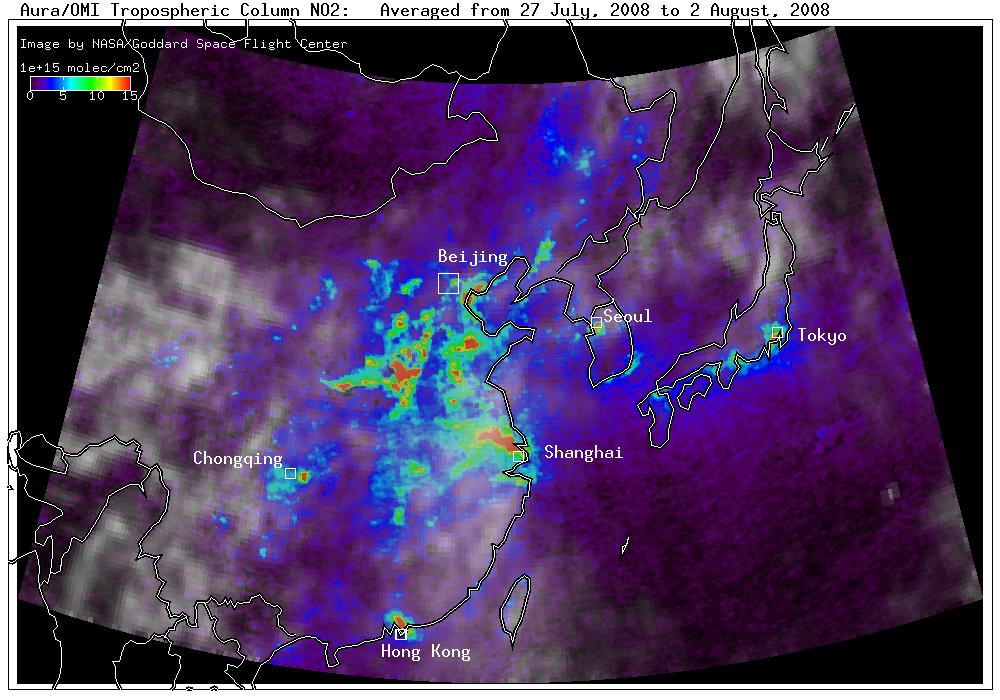
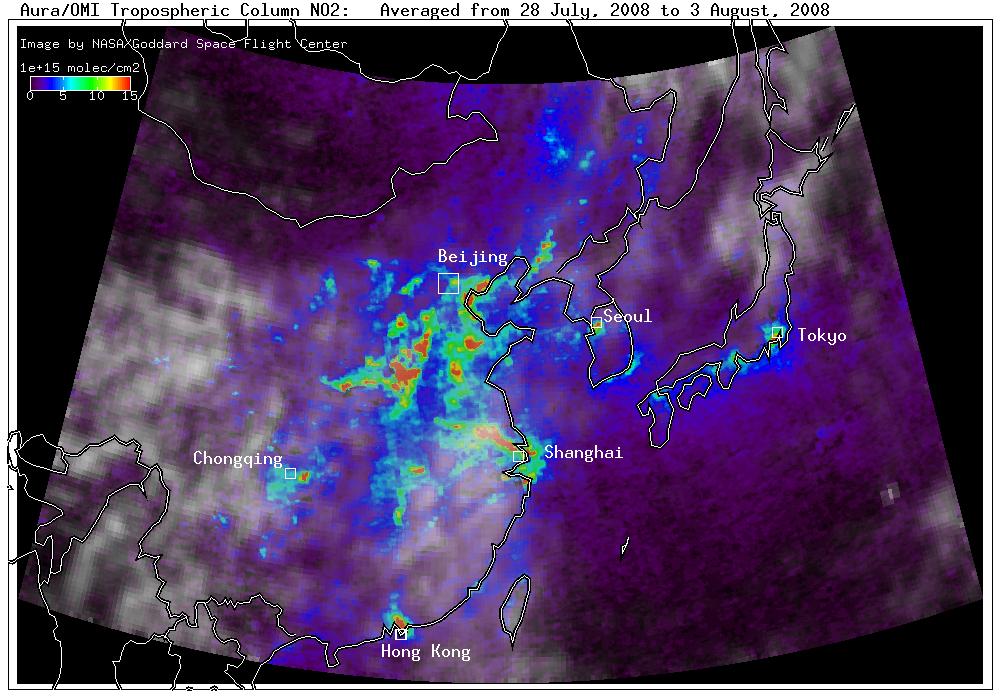
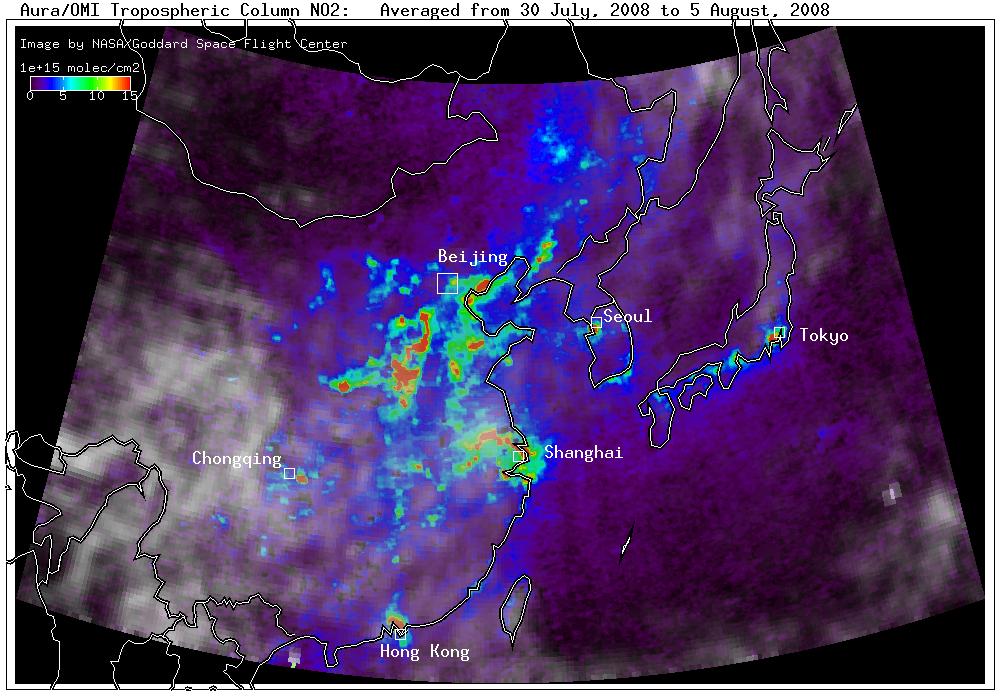
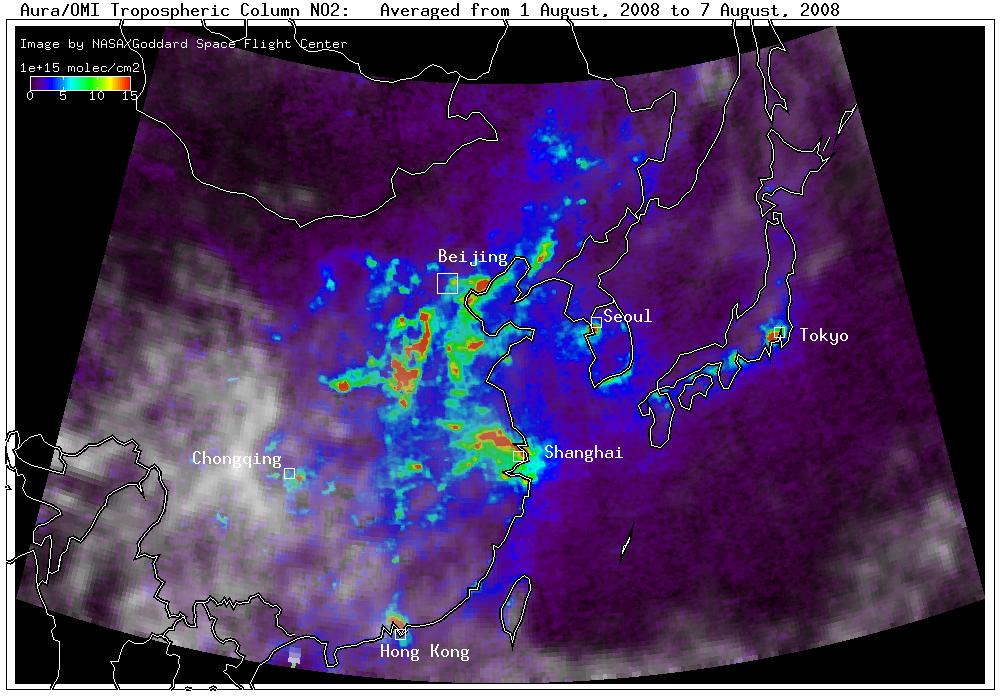
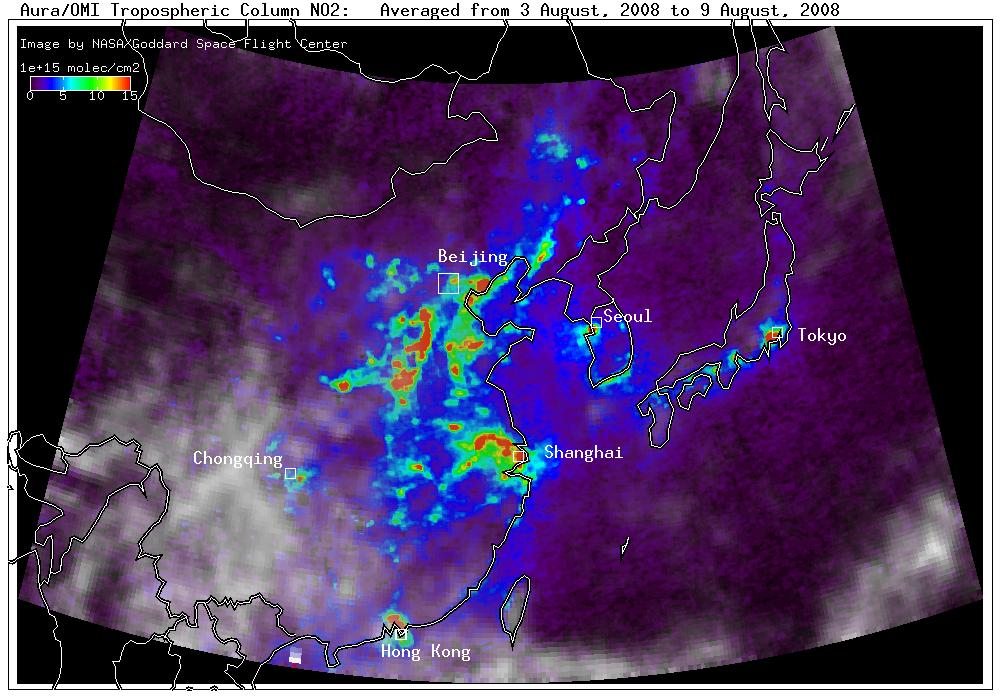
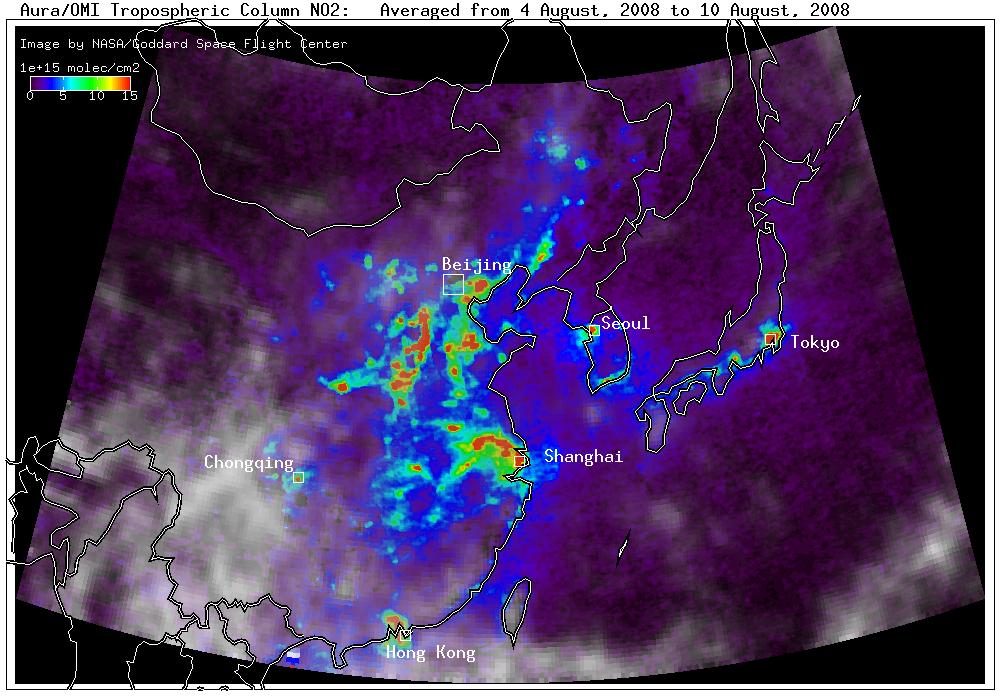
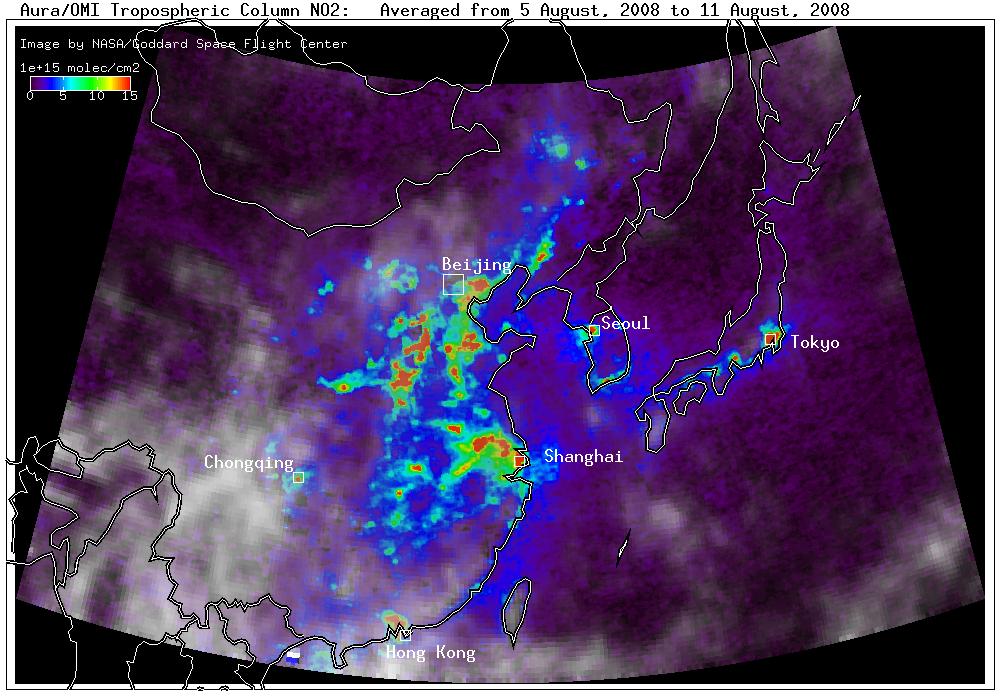
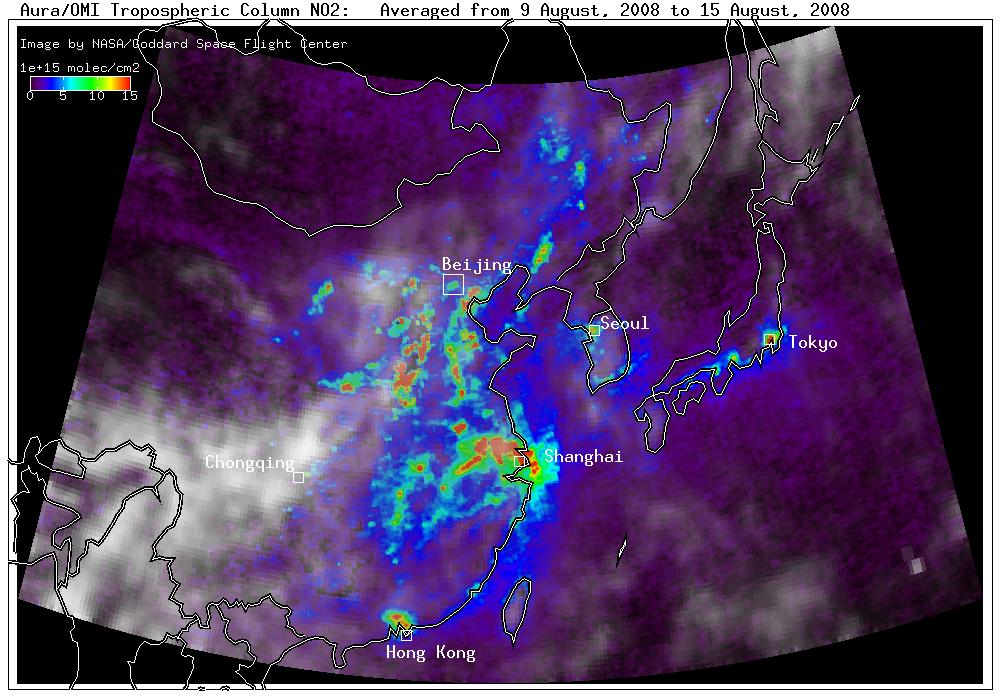
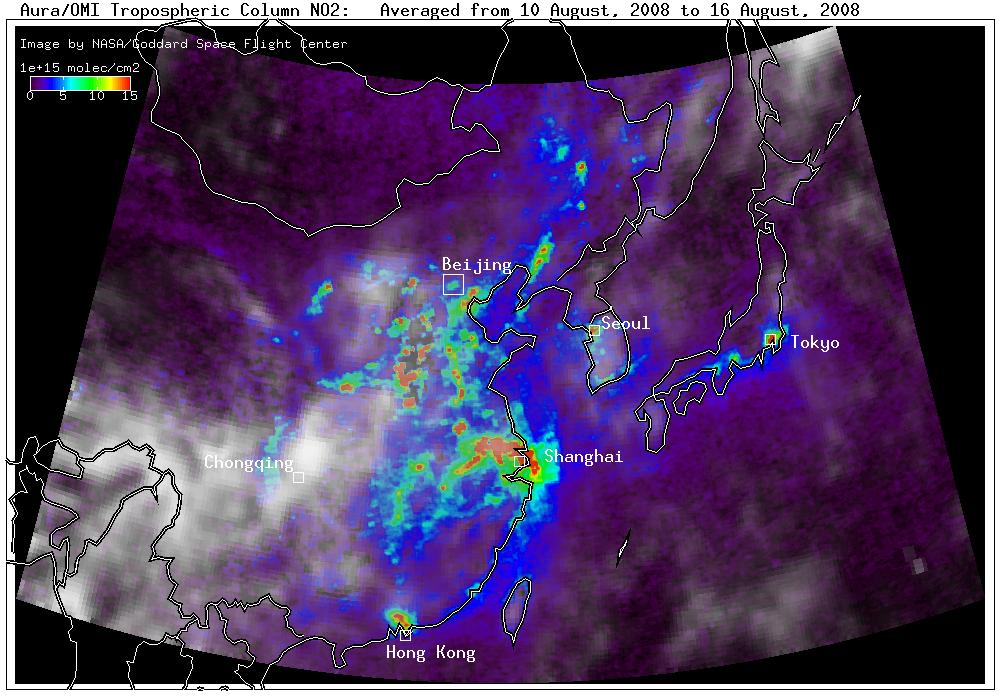
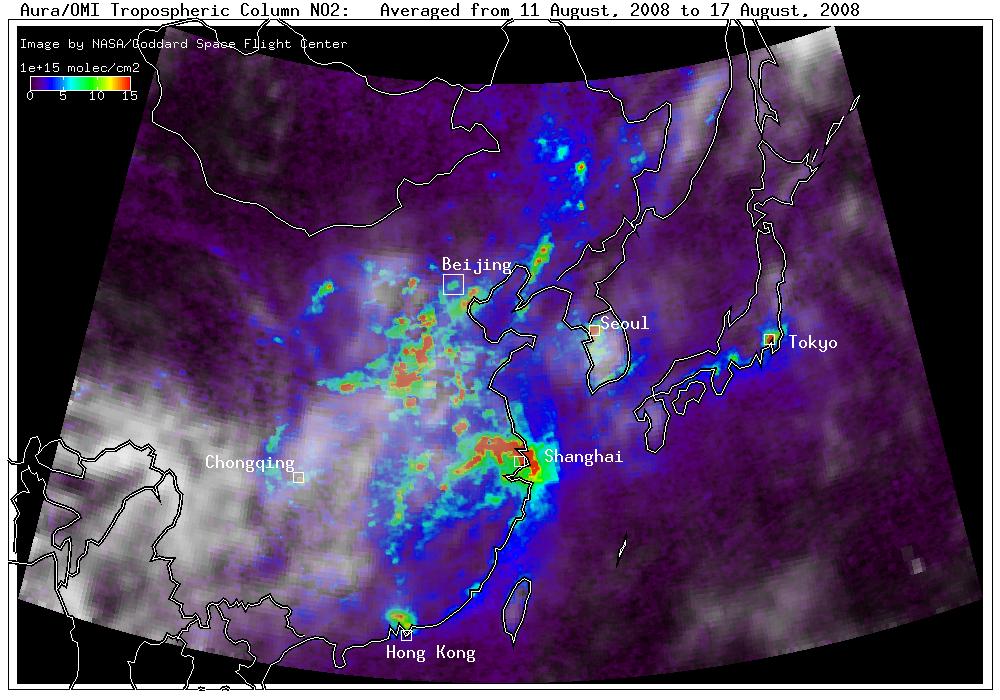
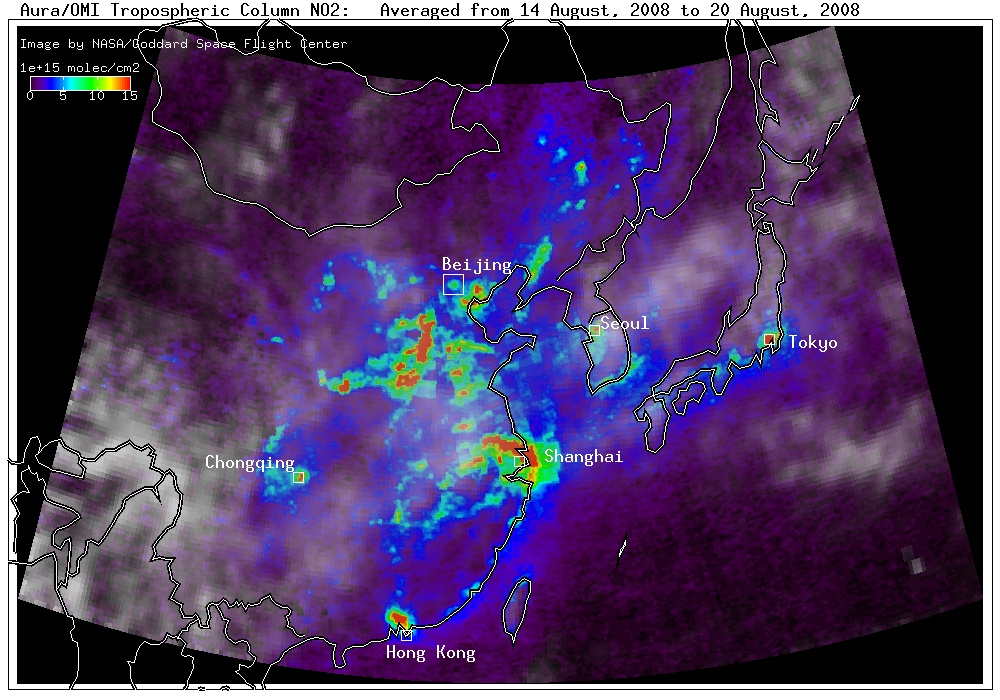
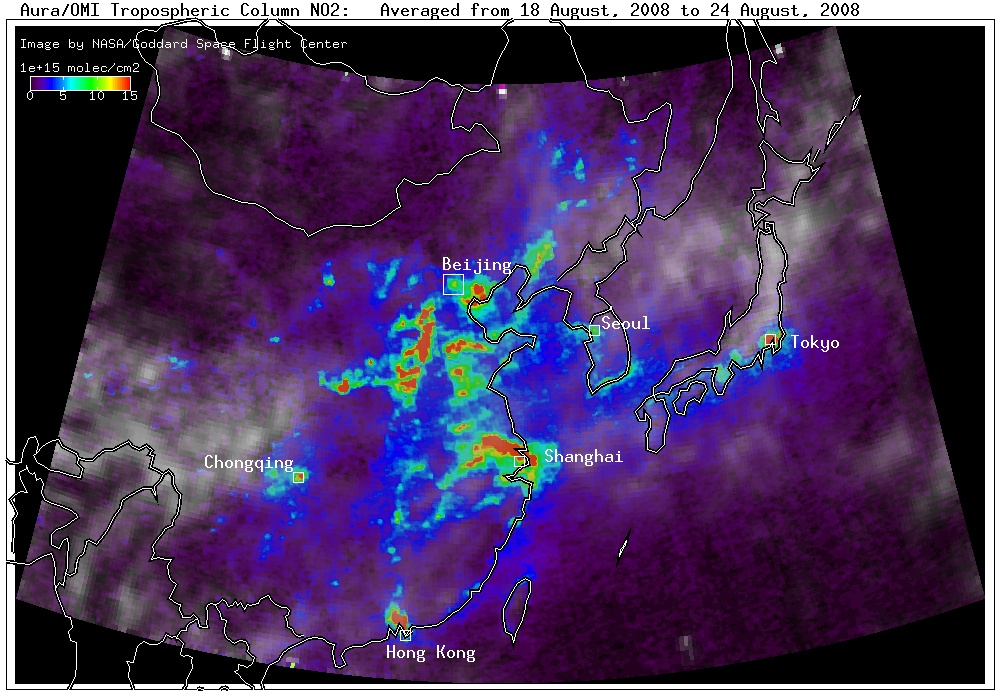
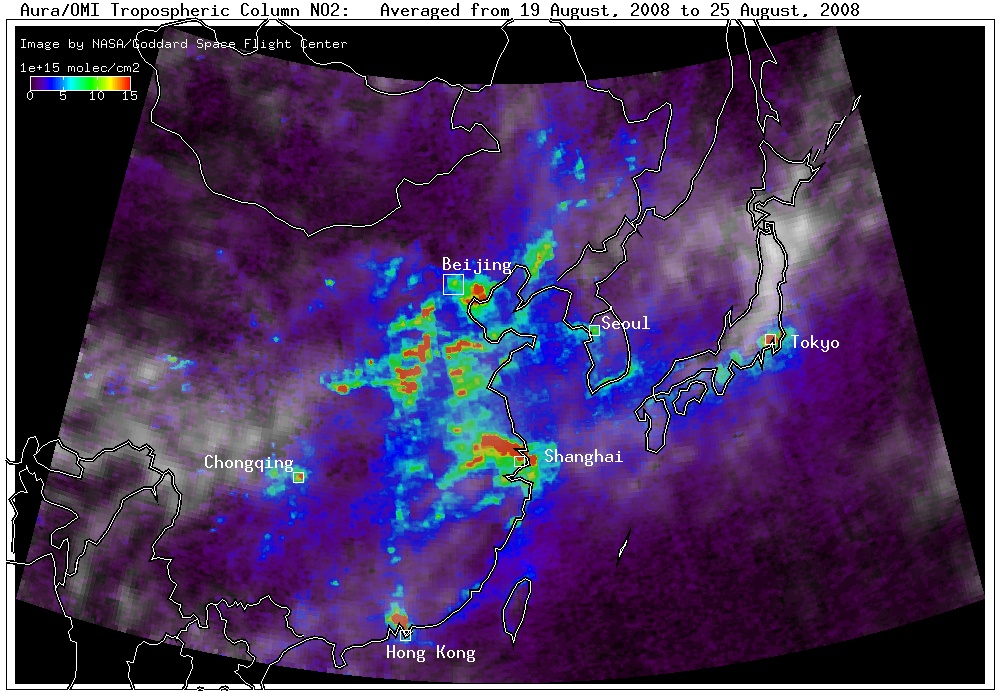
OMI tropospheric NO2 observations averaged from July through August 2008. NO2 is an important precursor for tropospheric ozone, which is harmful to human health and certain vegetation.
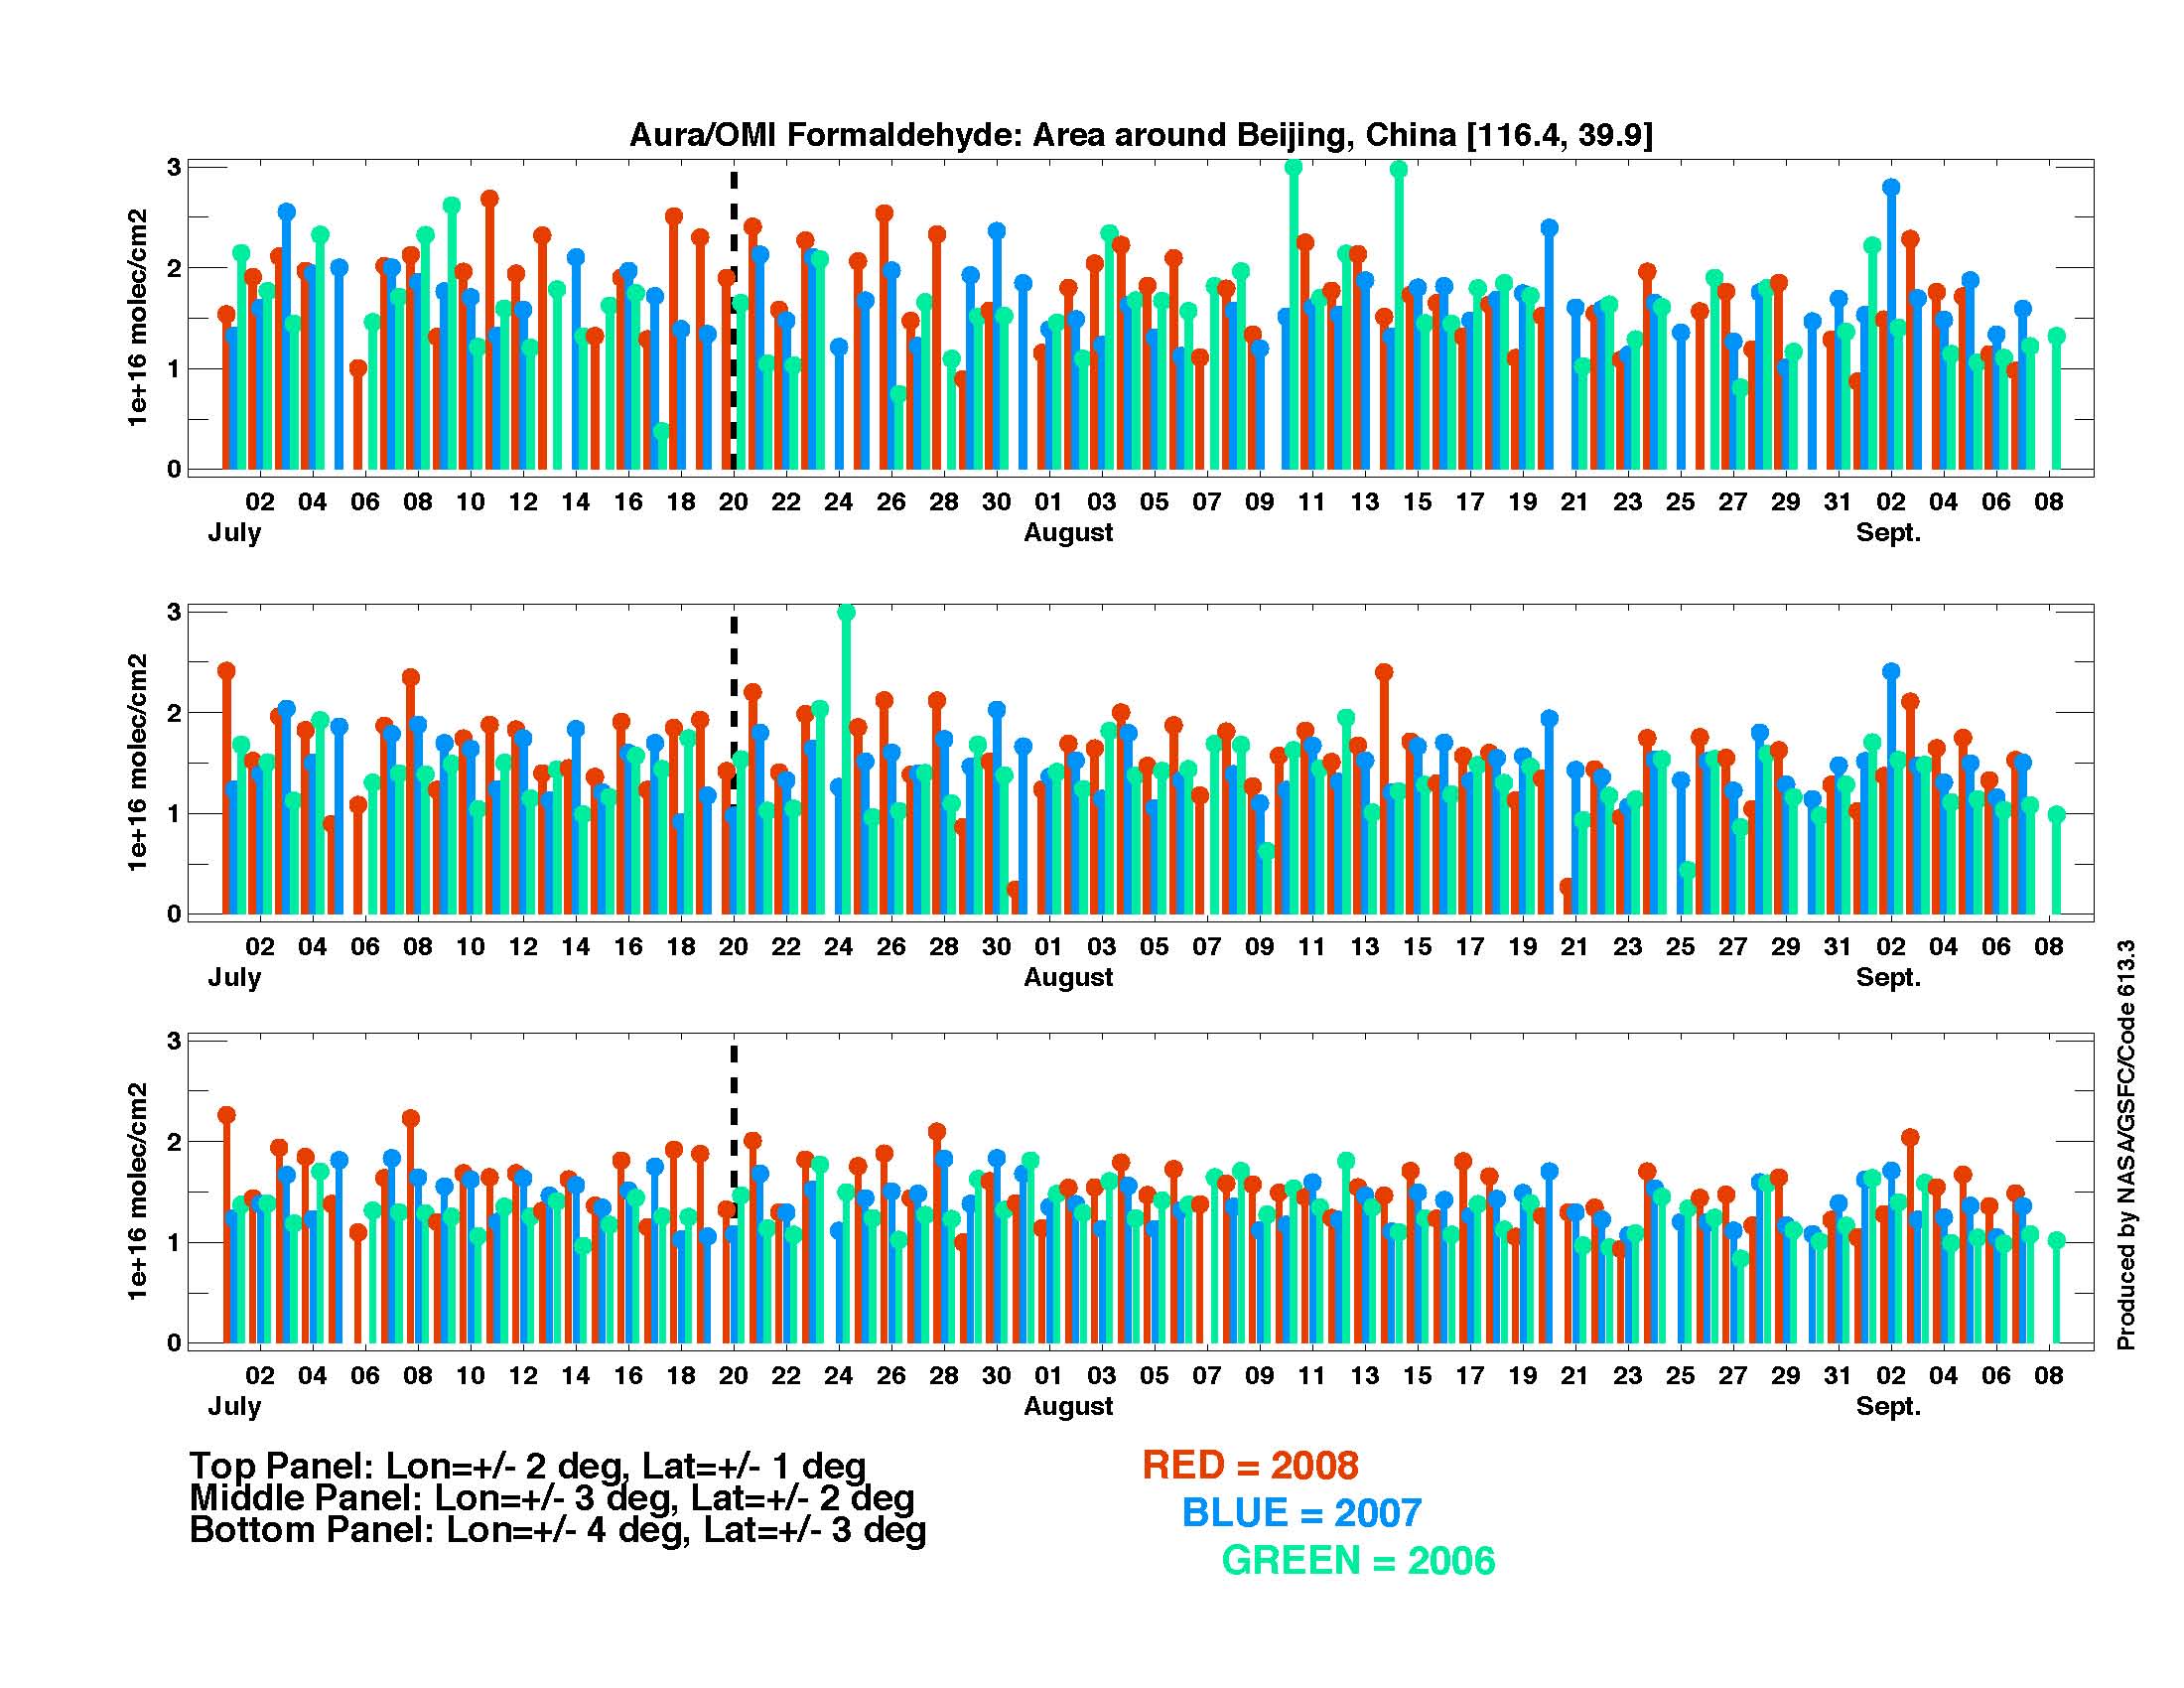
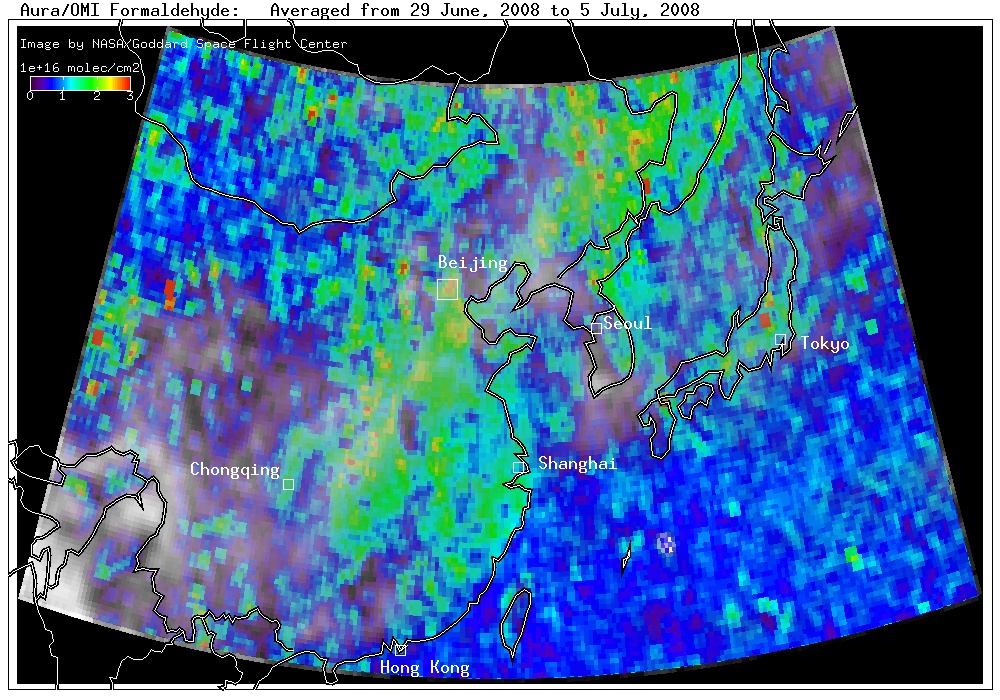
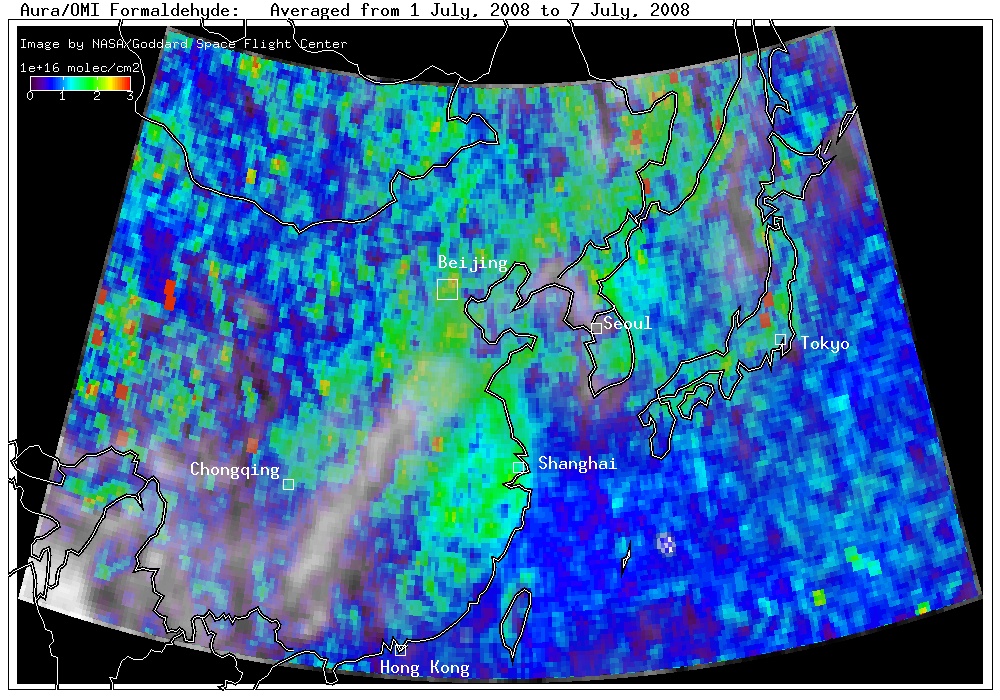
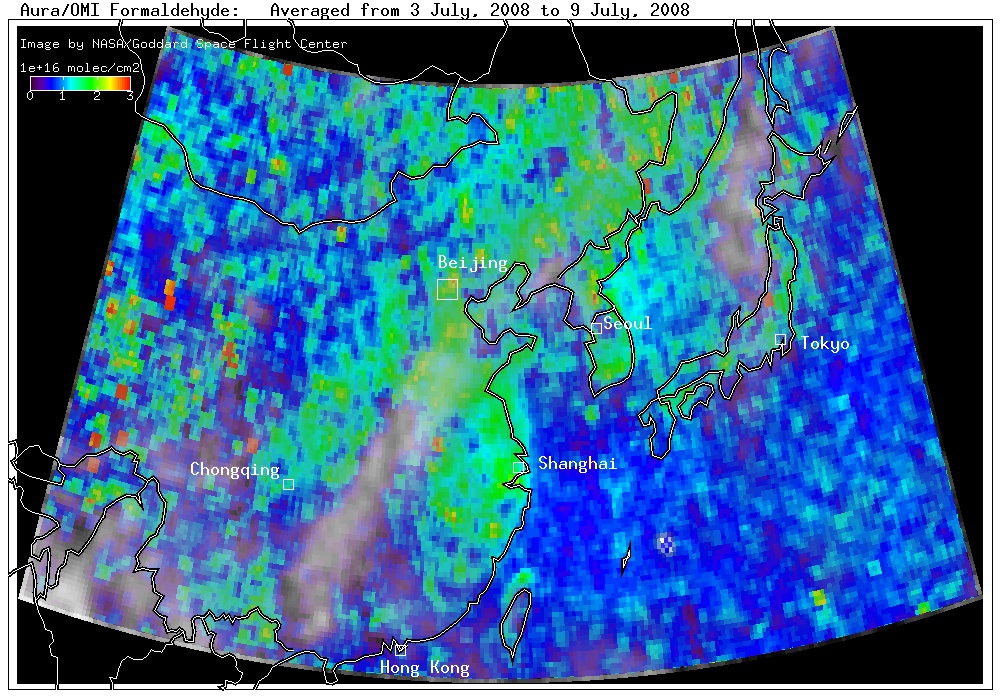
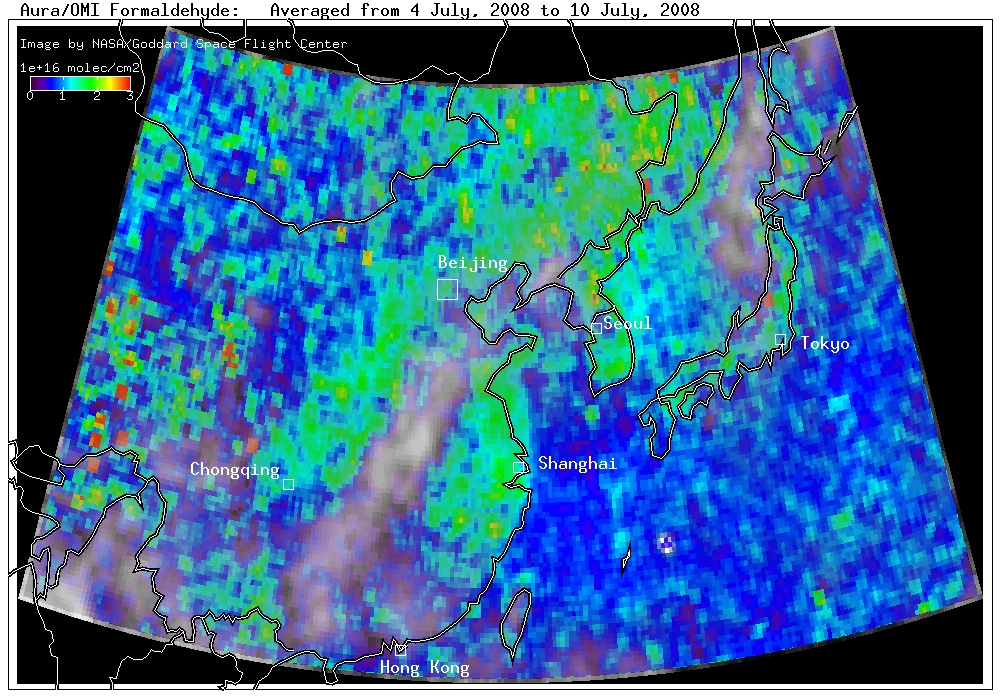
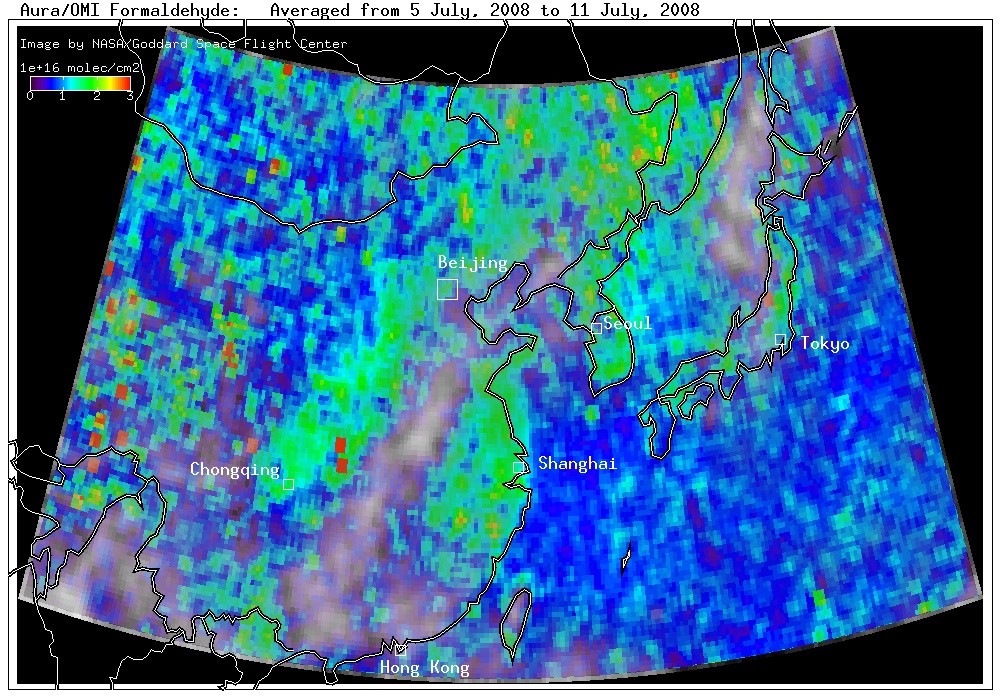
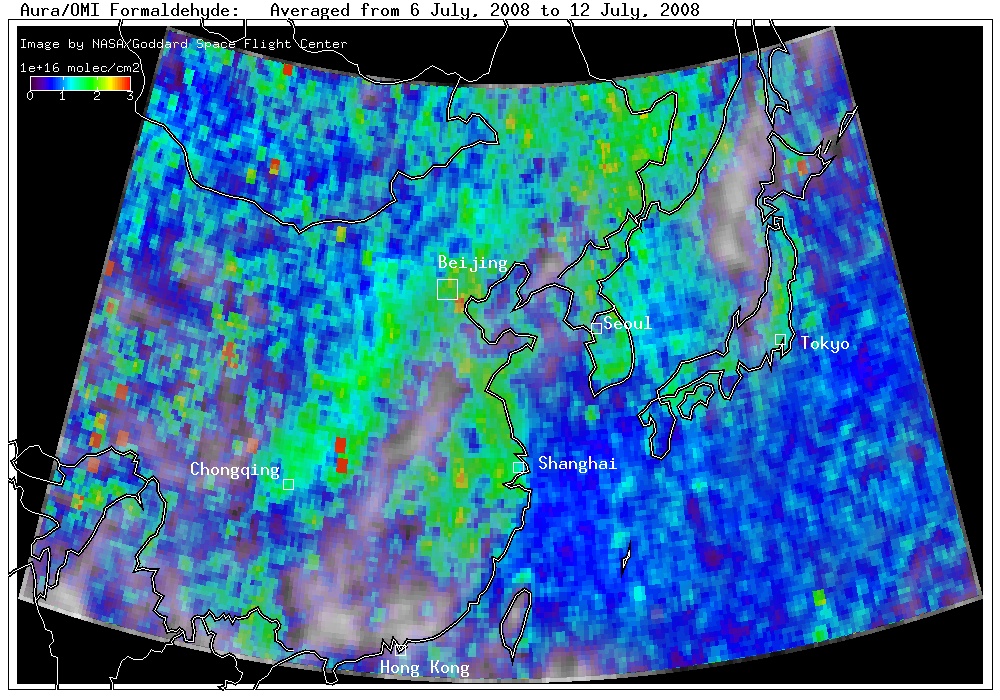
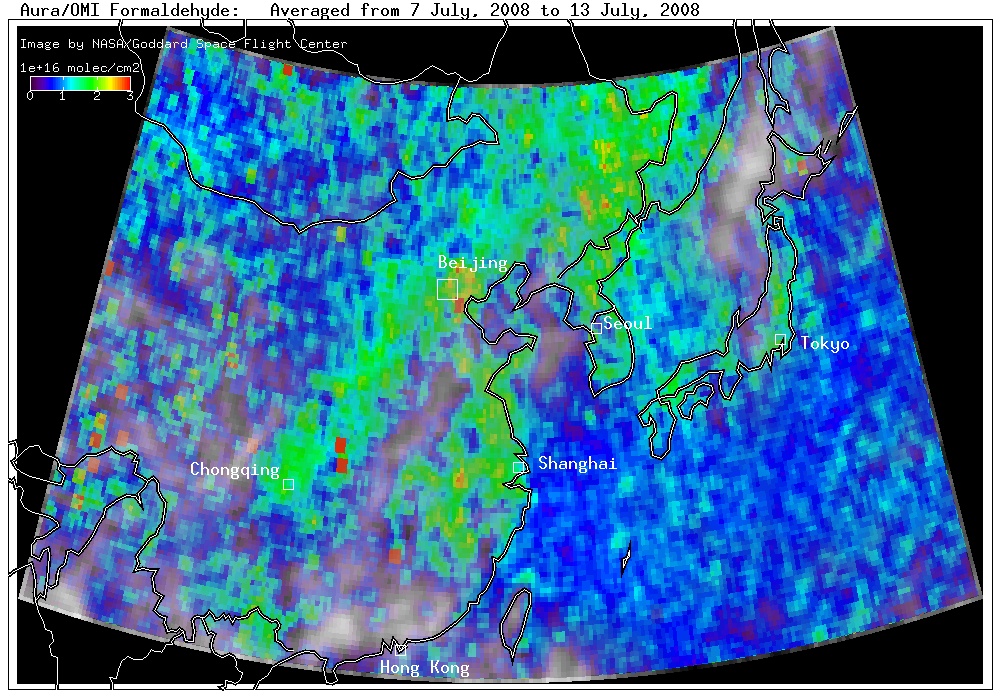
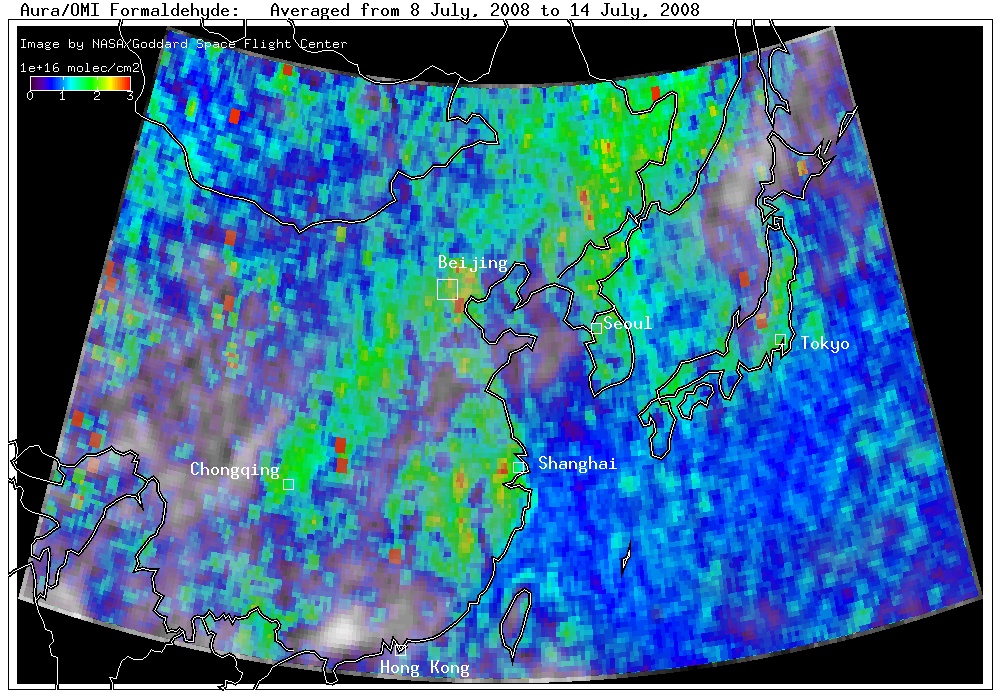
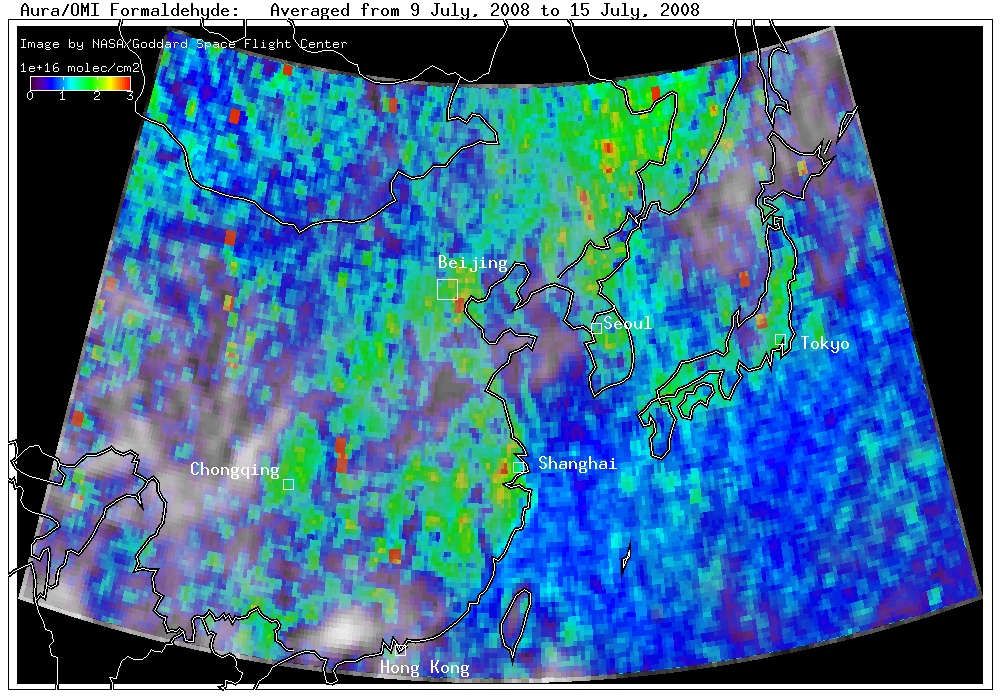
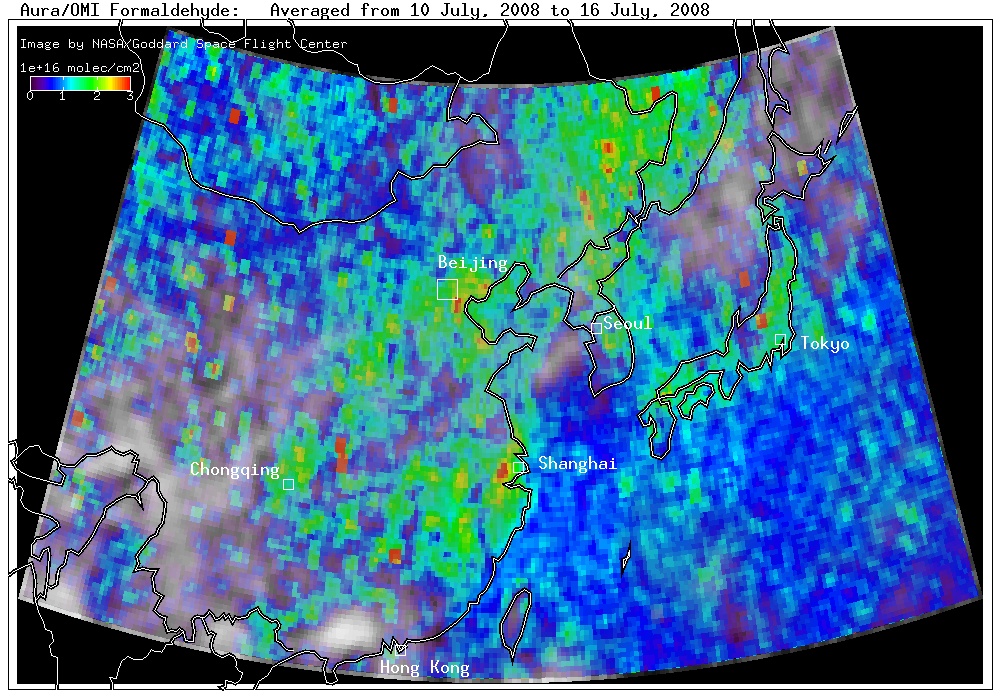
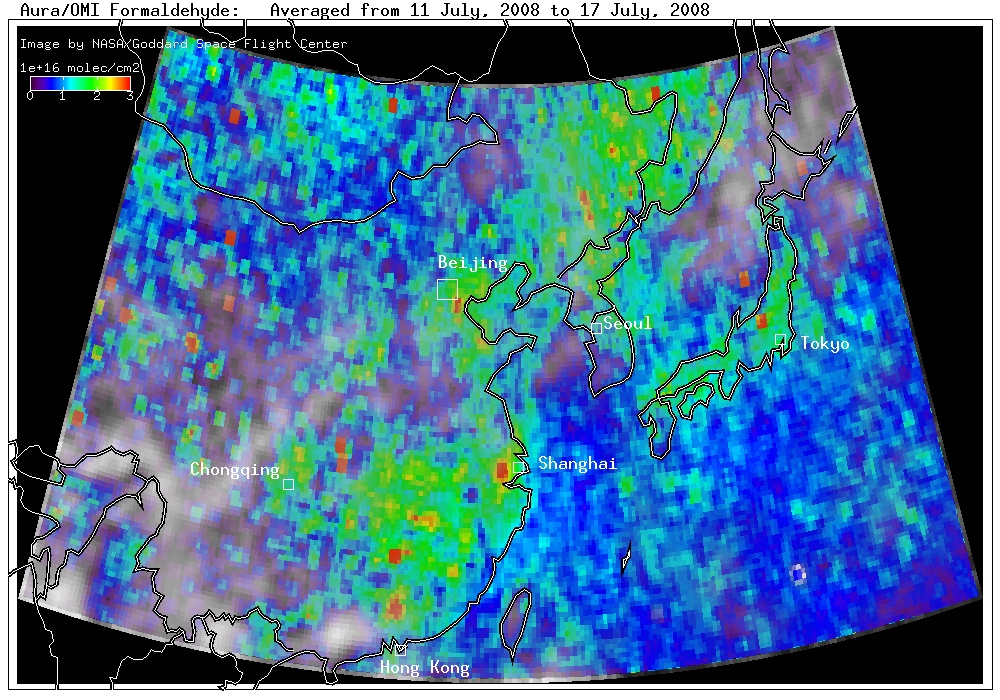
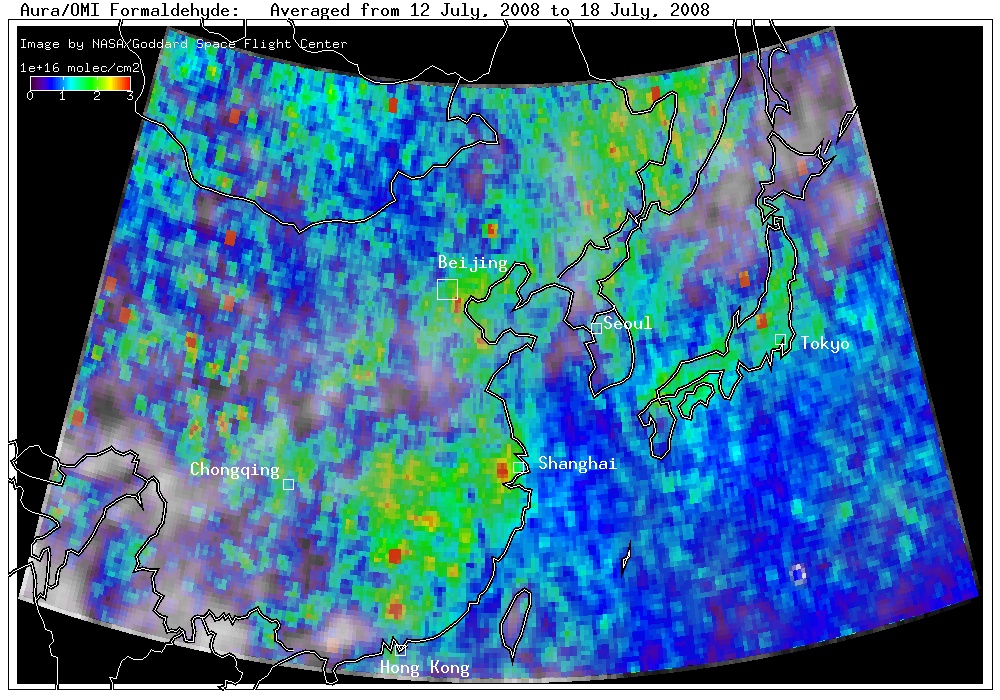
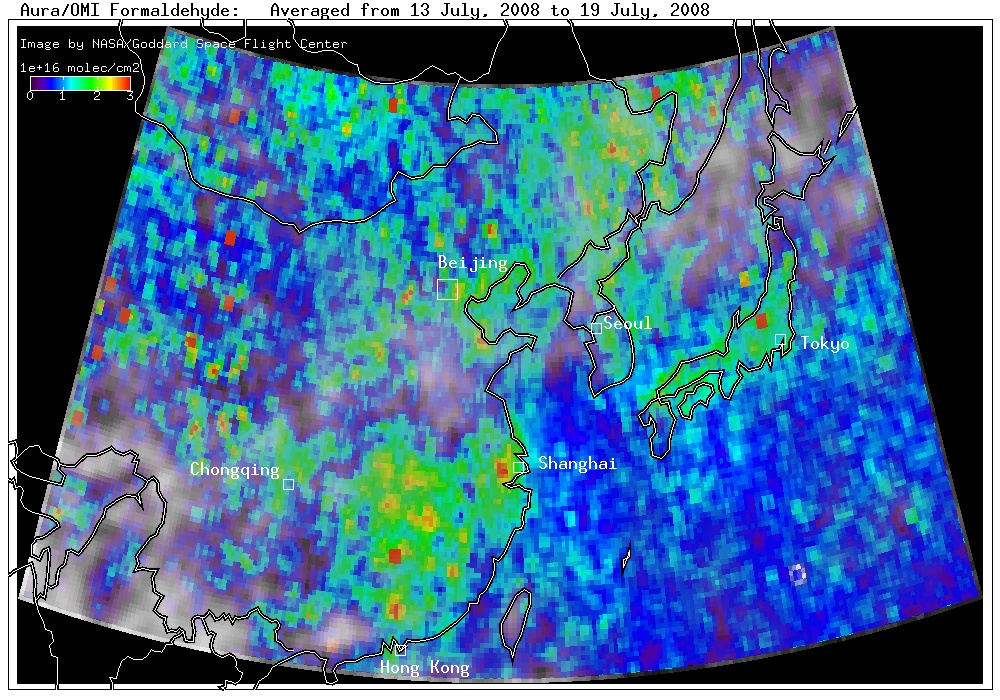
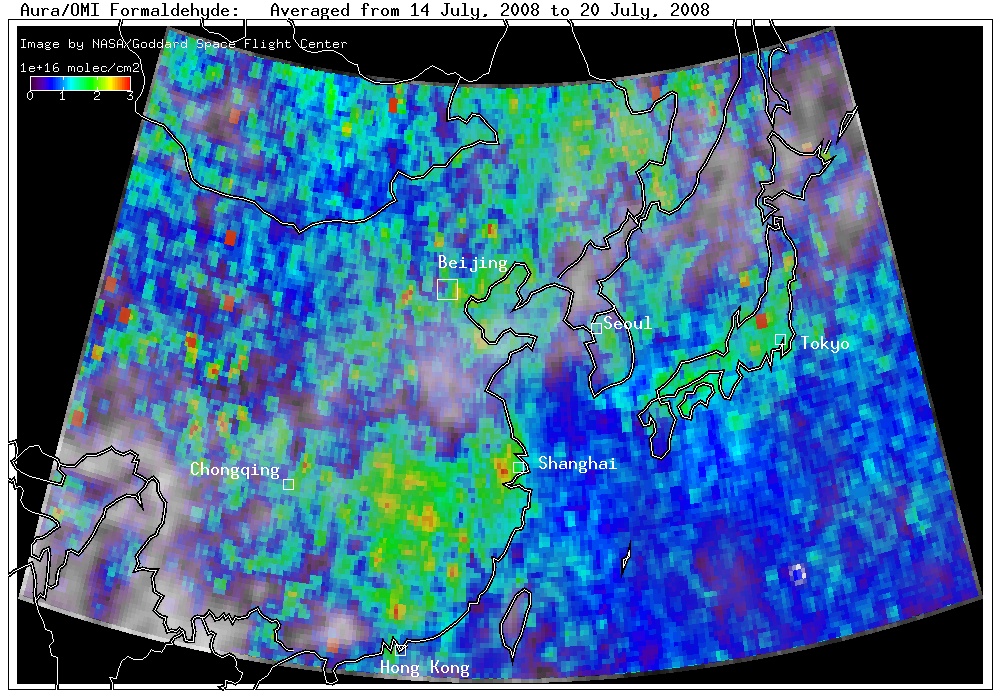
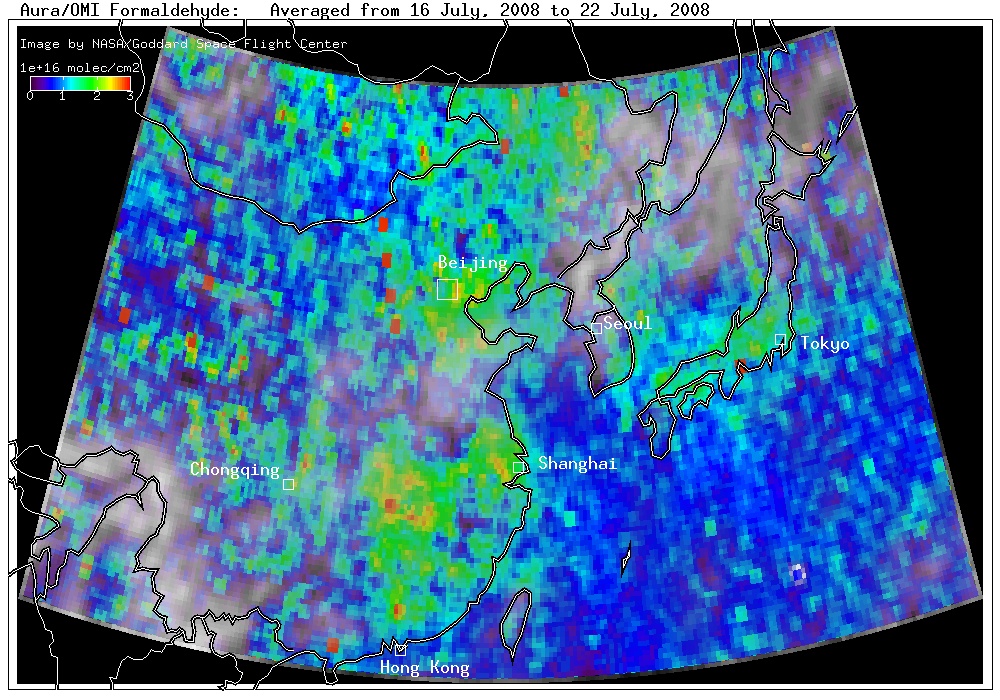
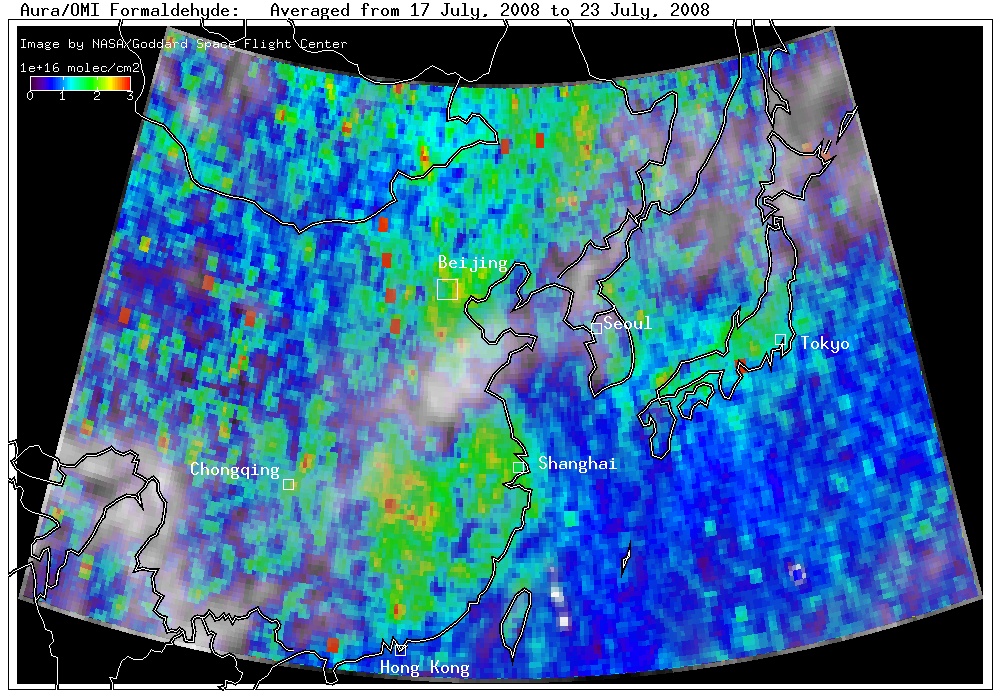
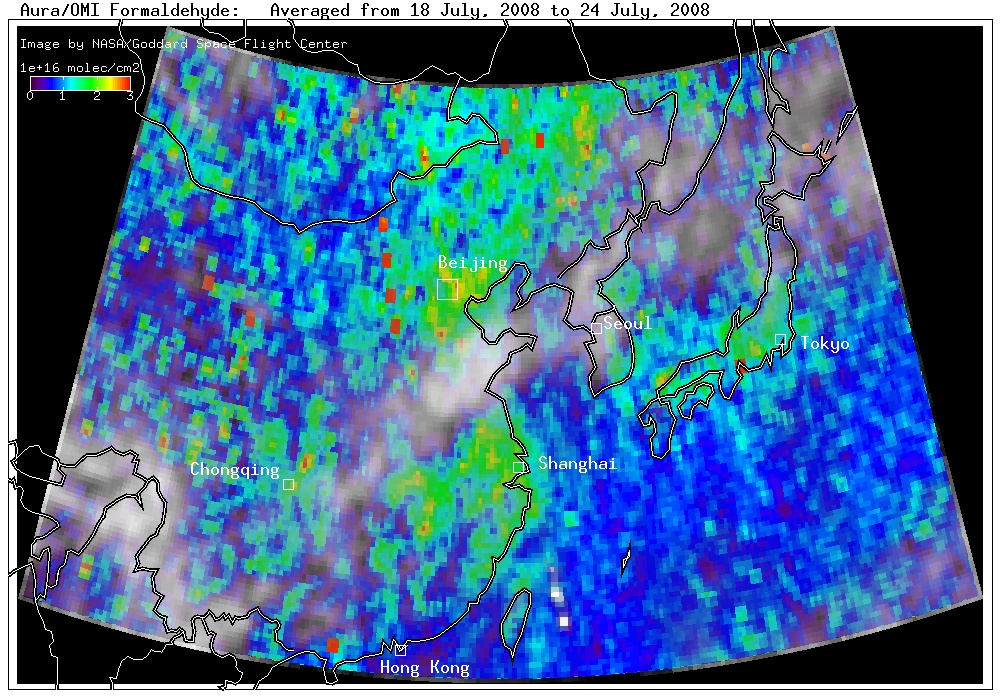
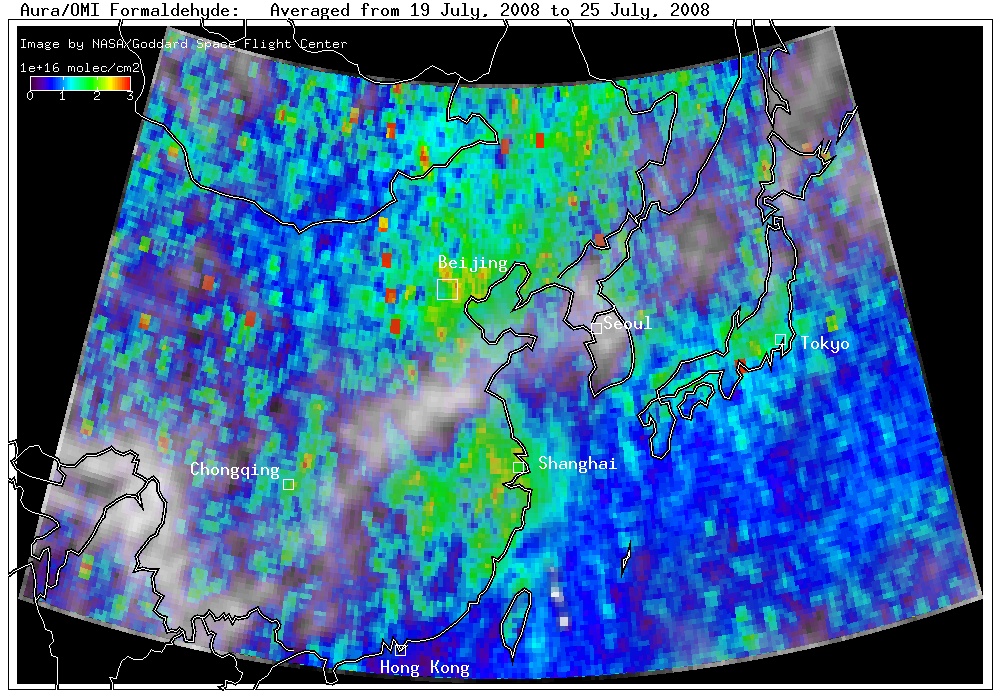
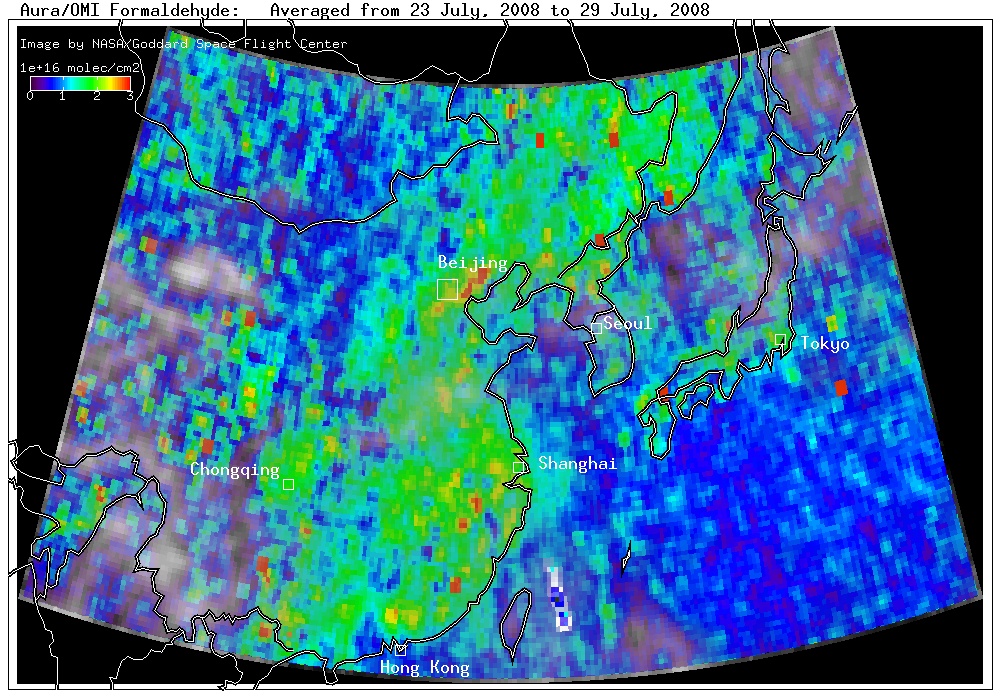
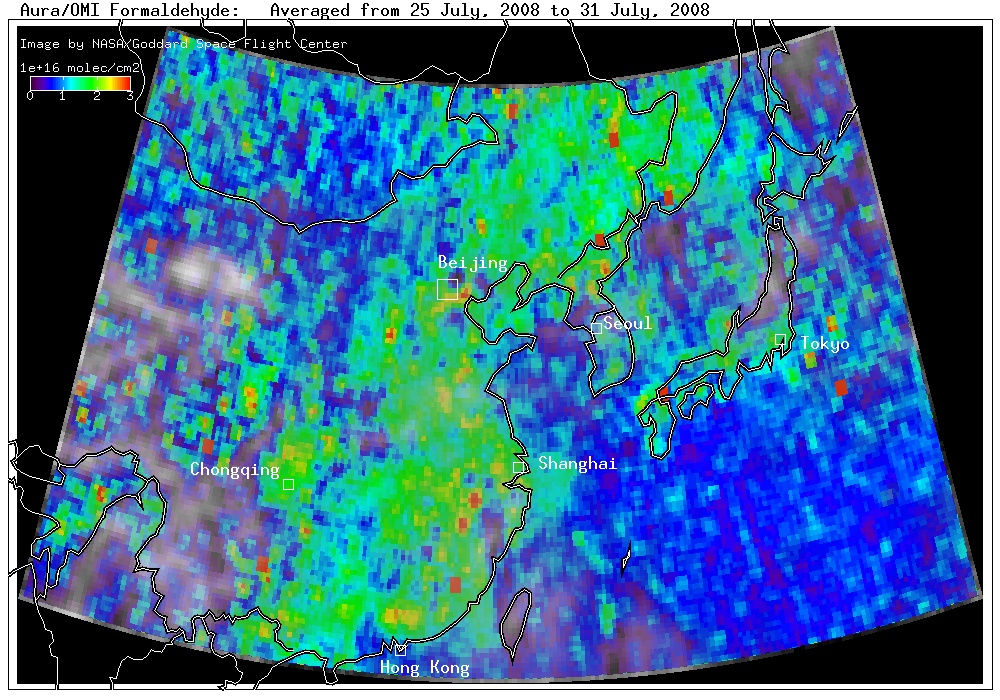
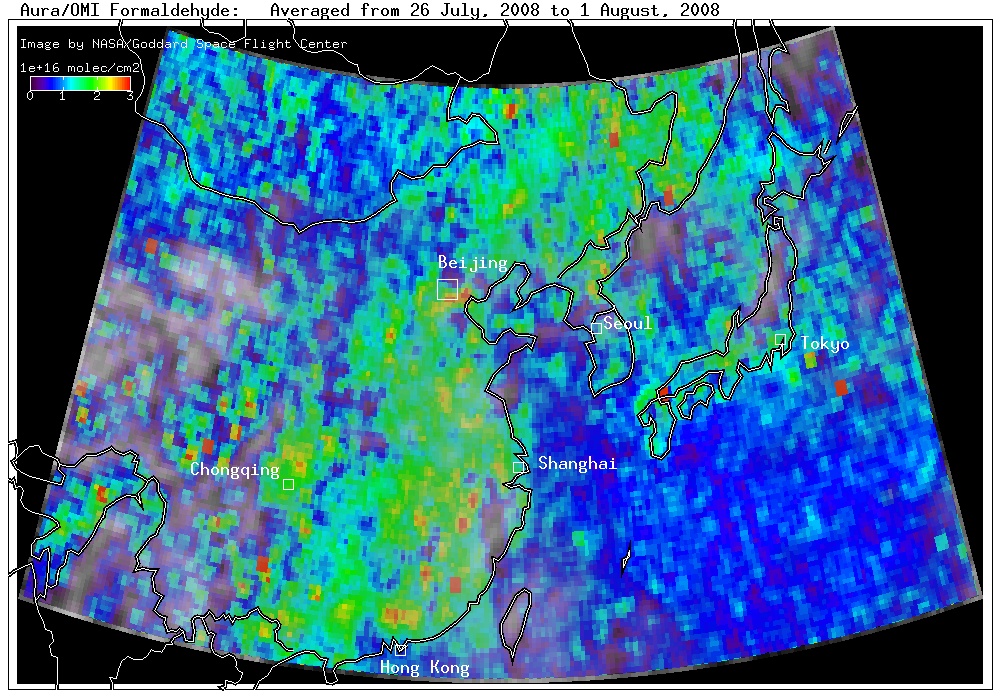
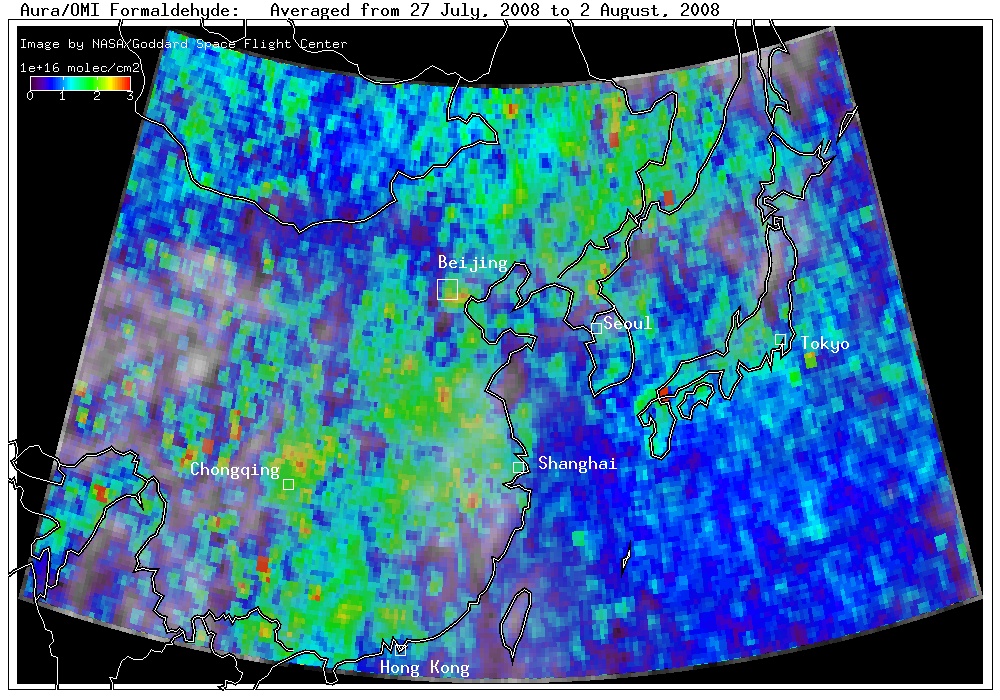
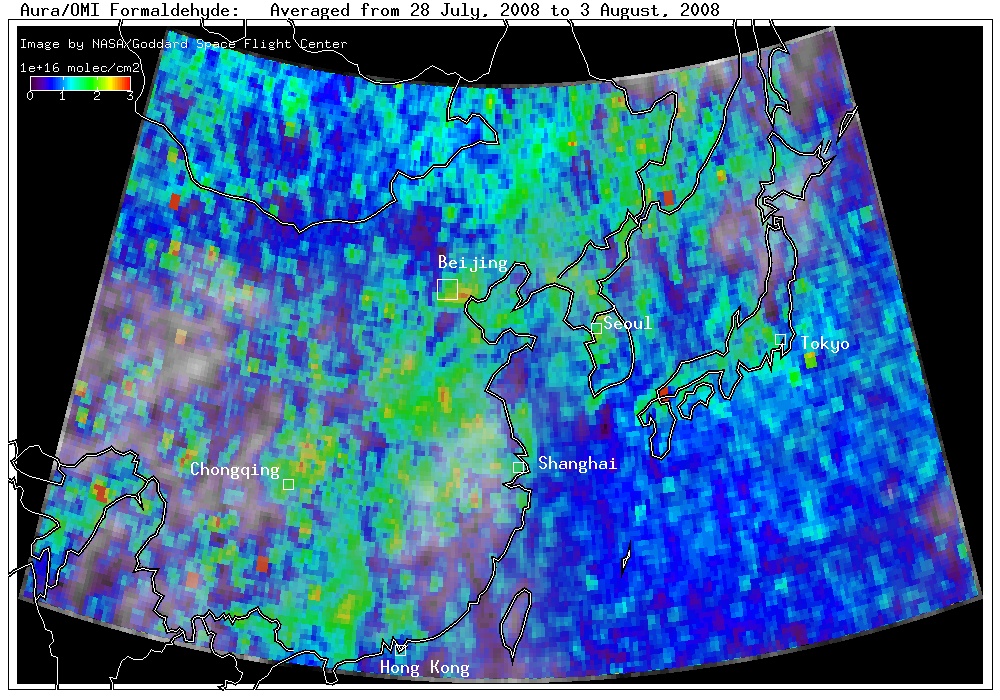
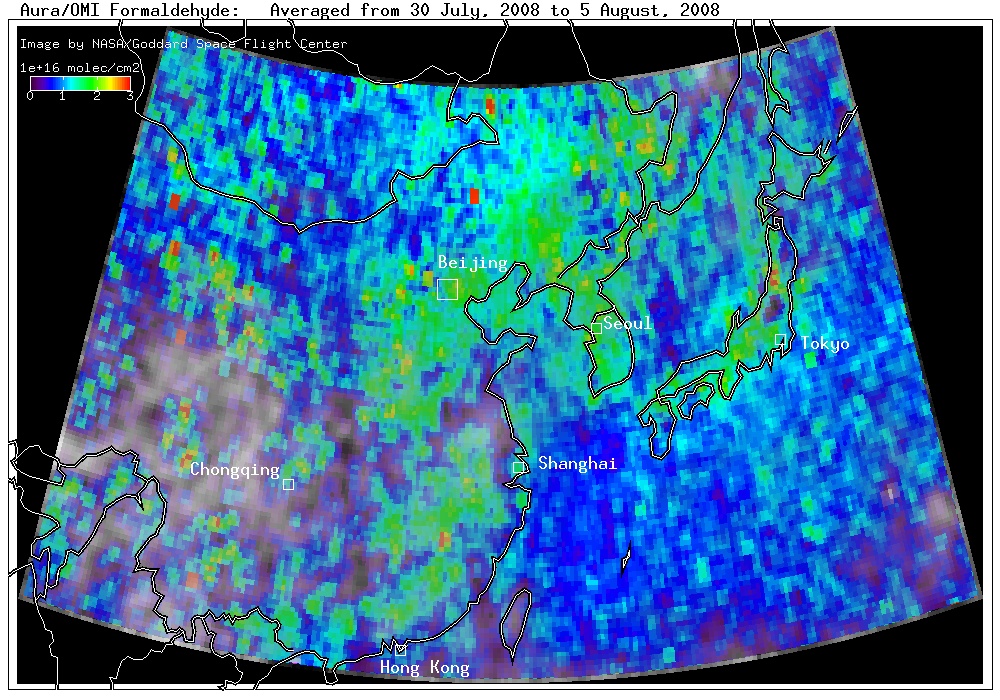
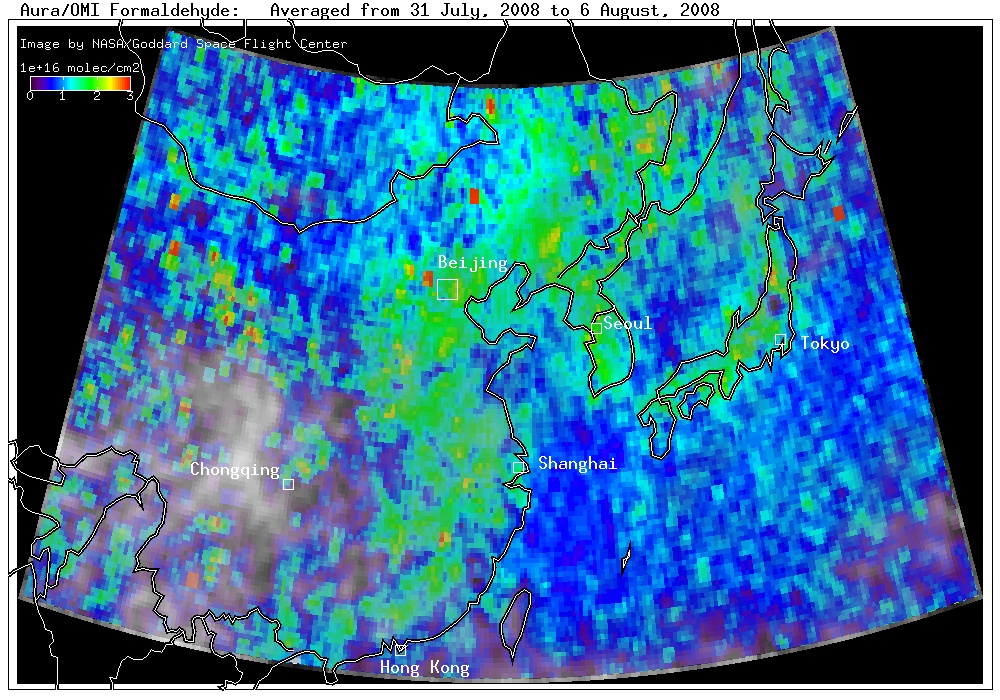
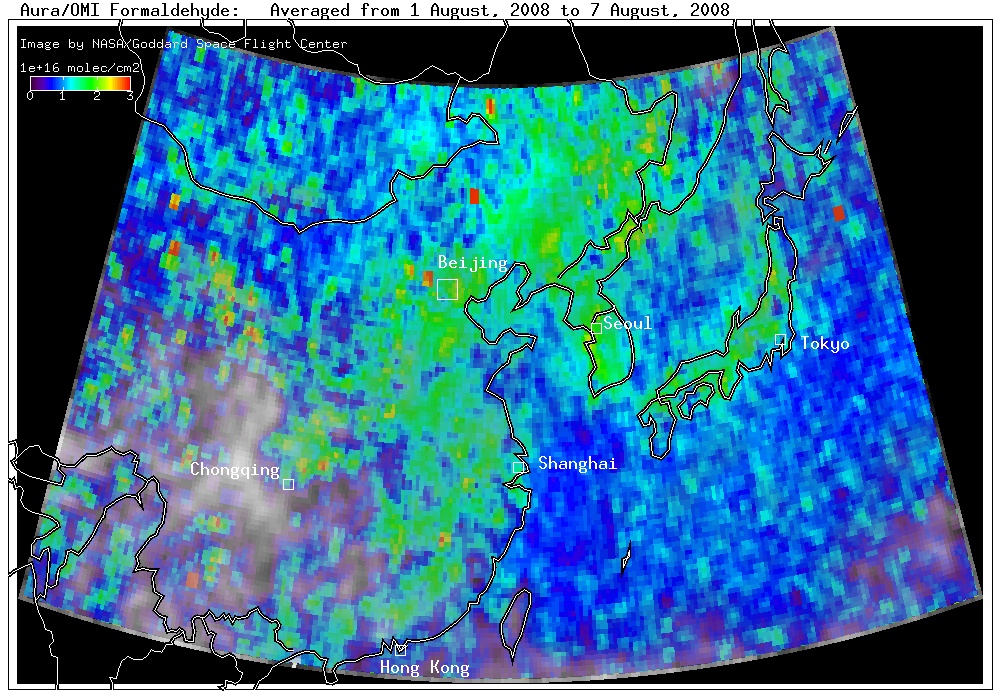
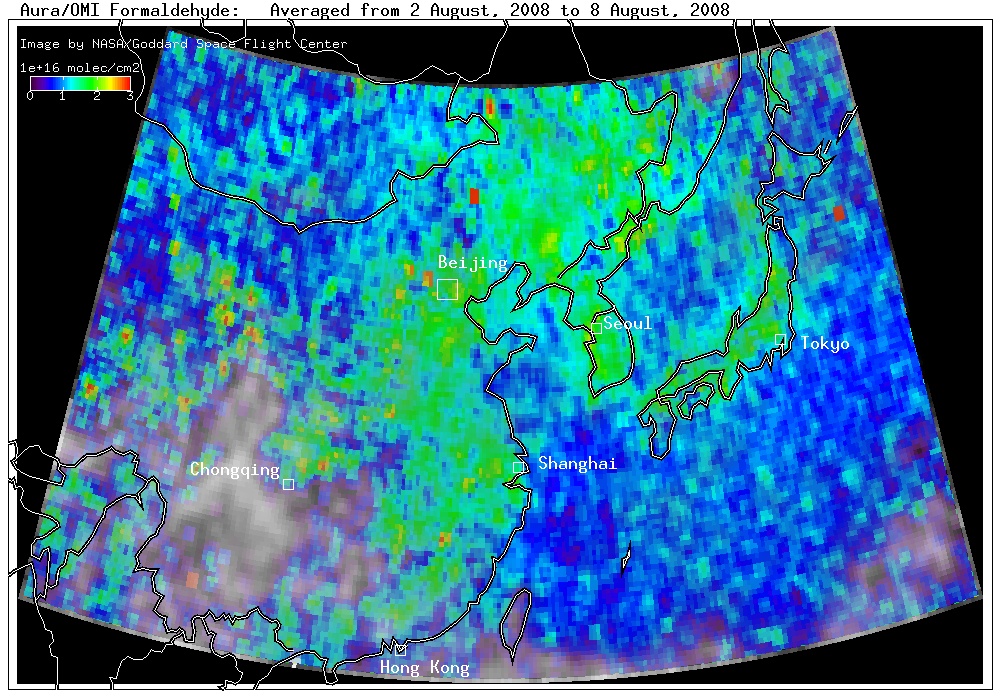
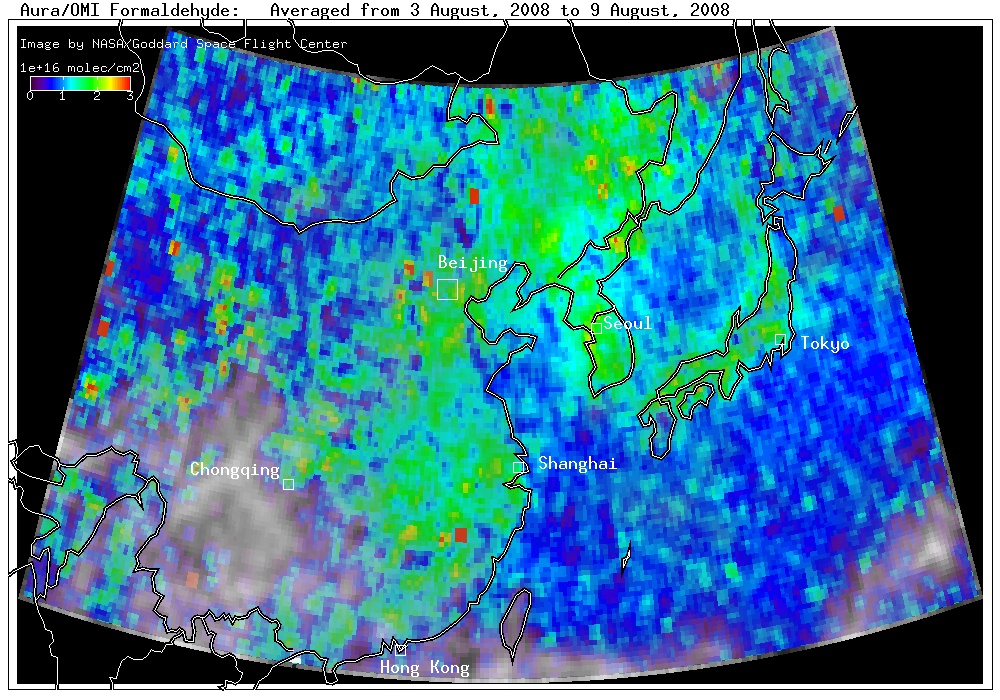
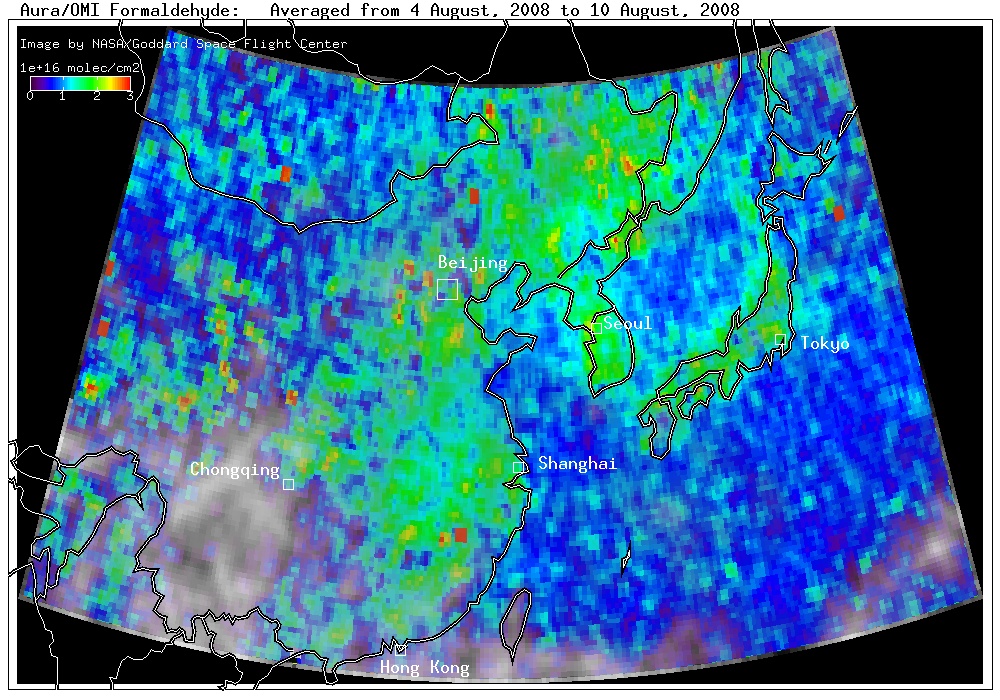
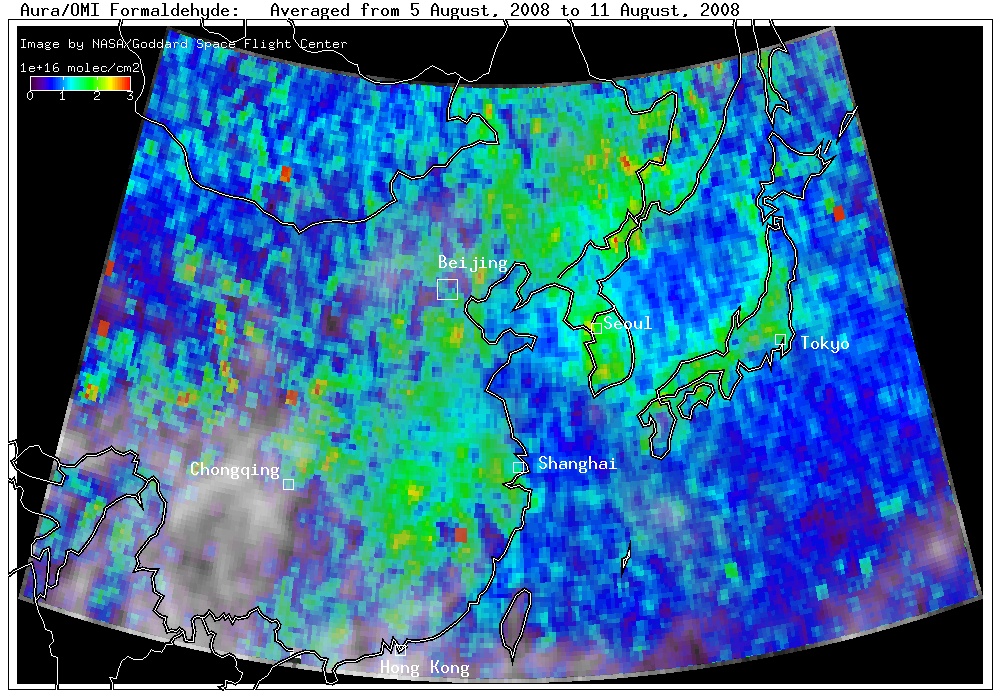
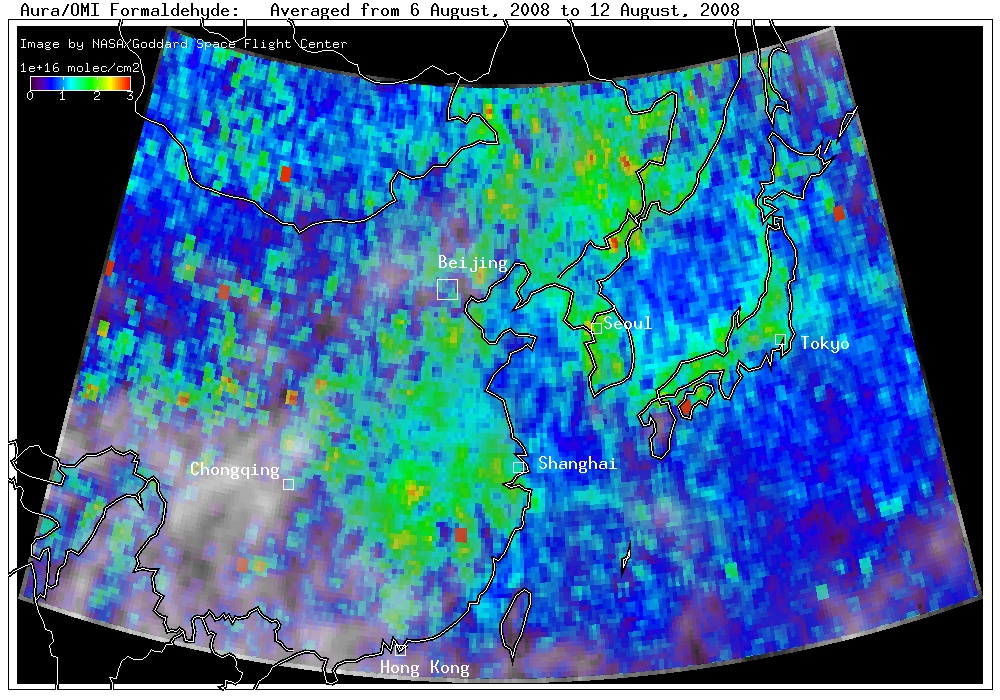
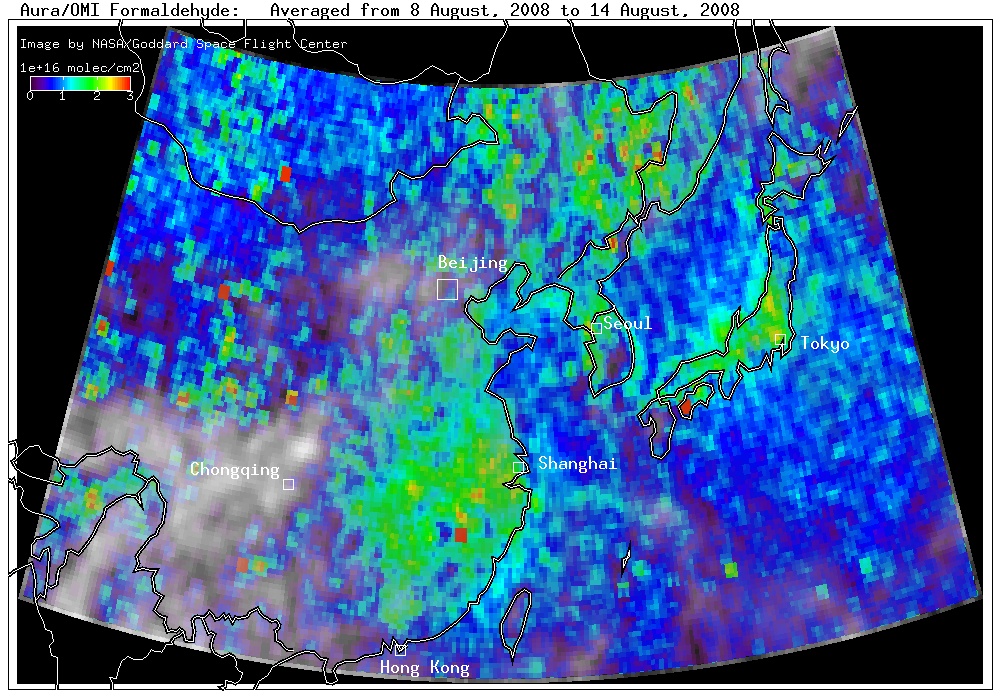
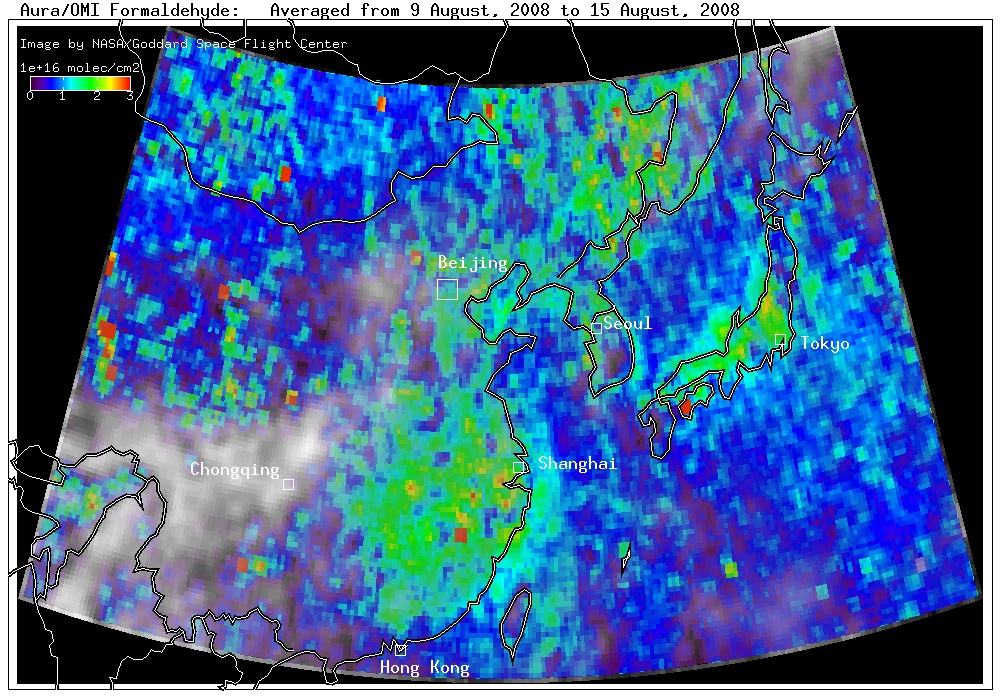
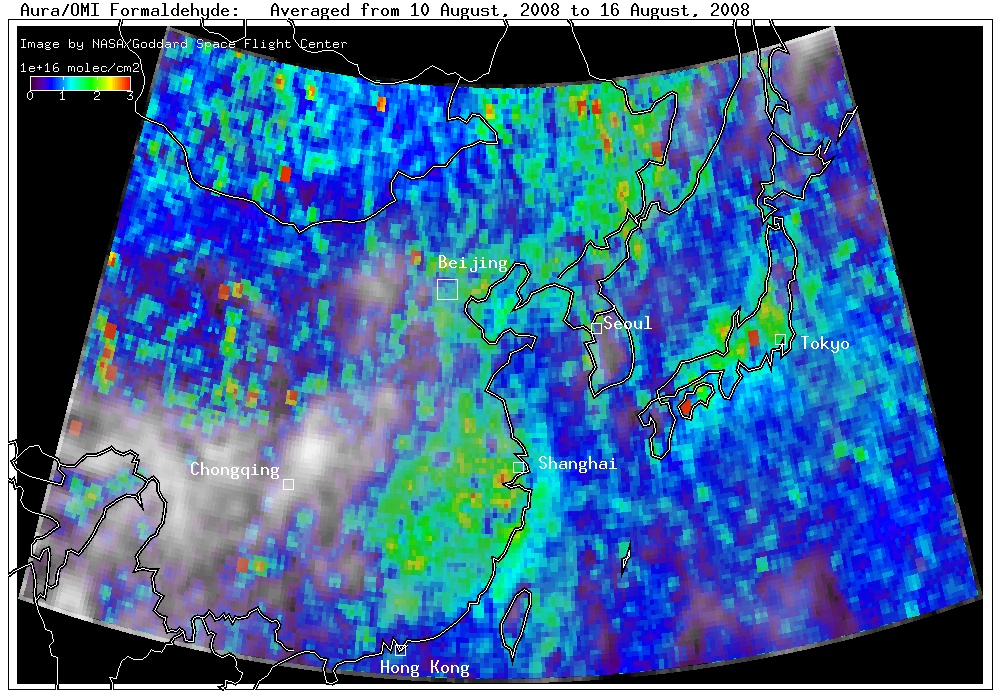
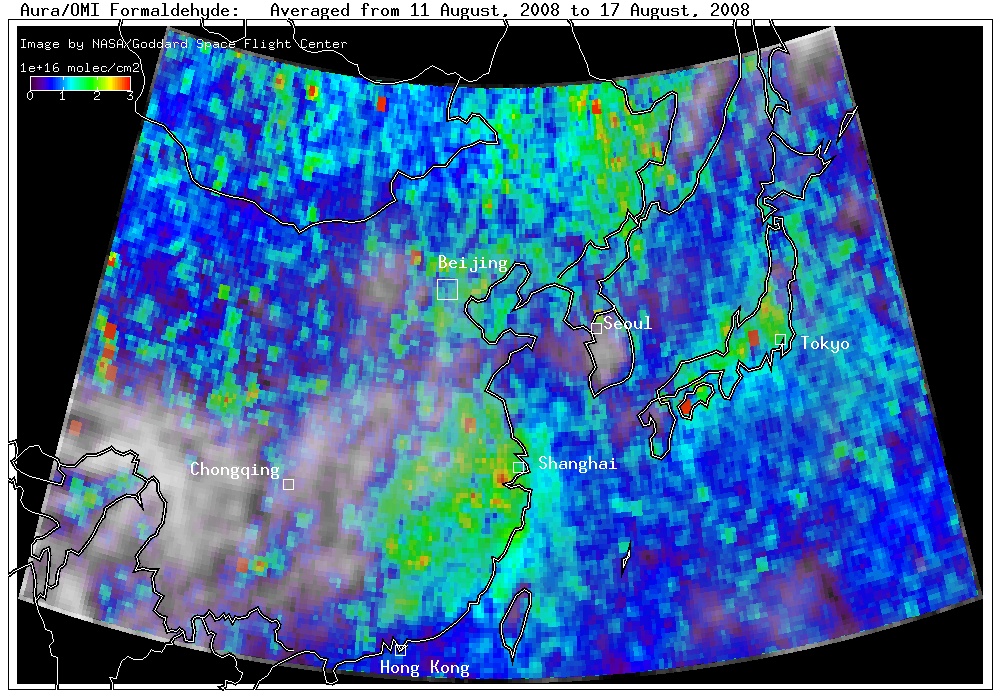
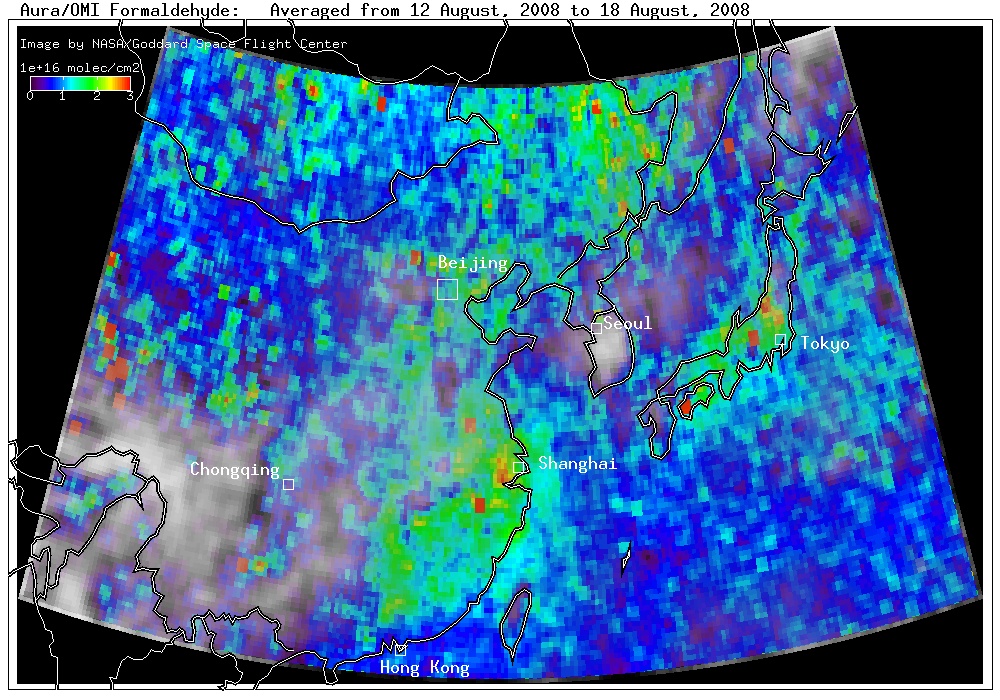
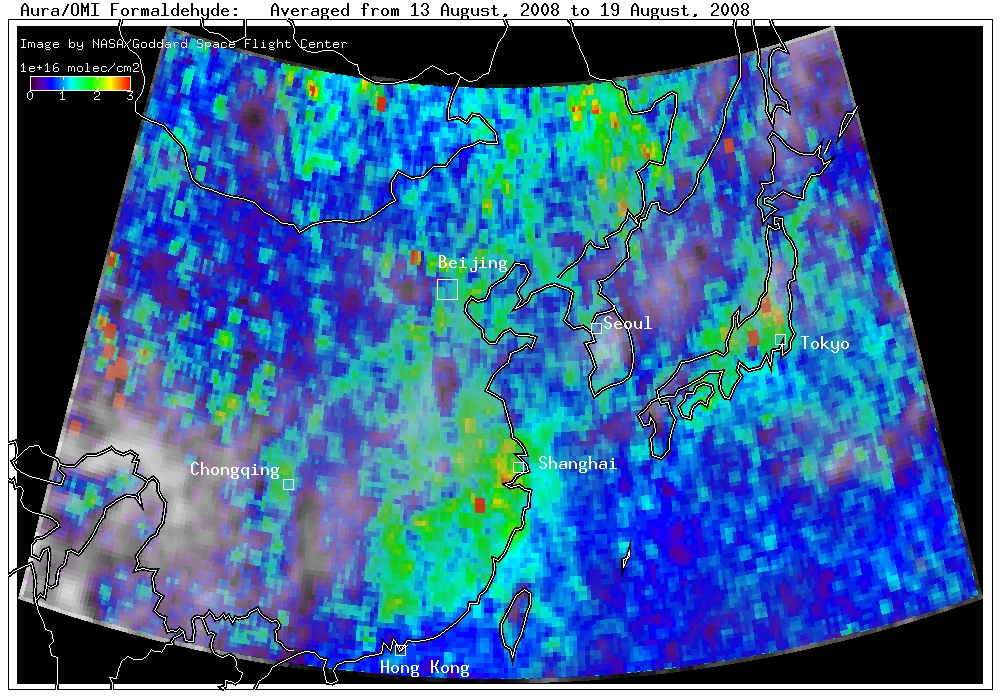
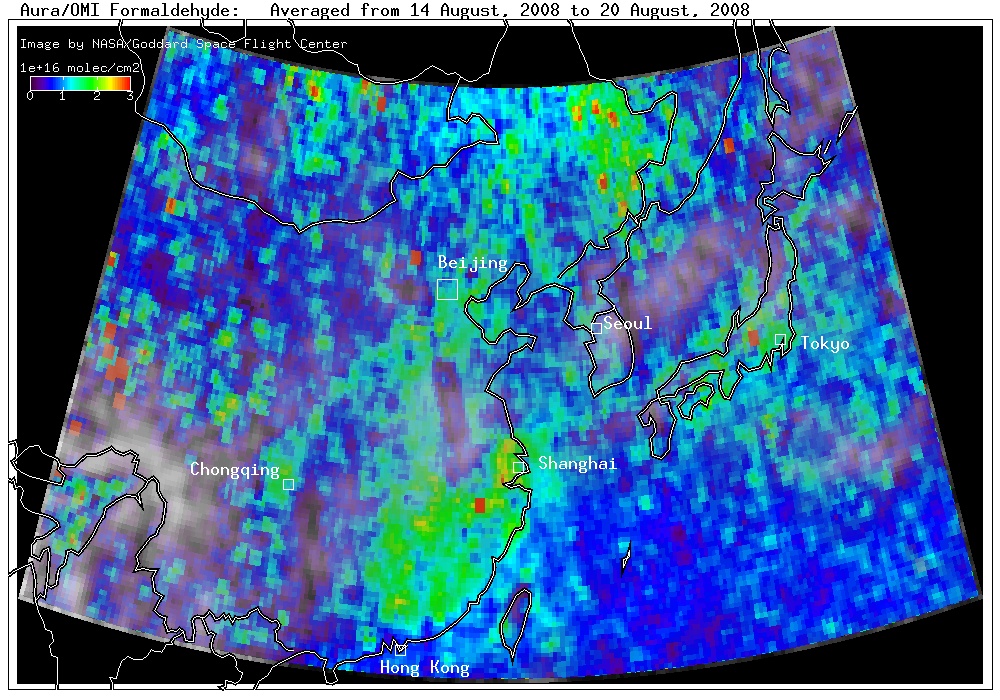
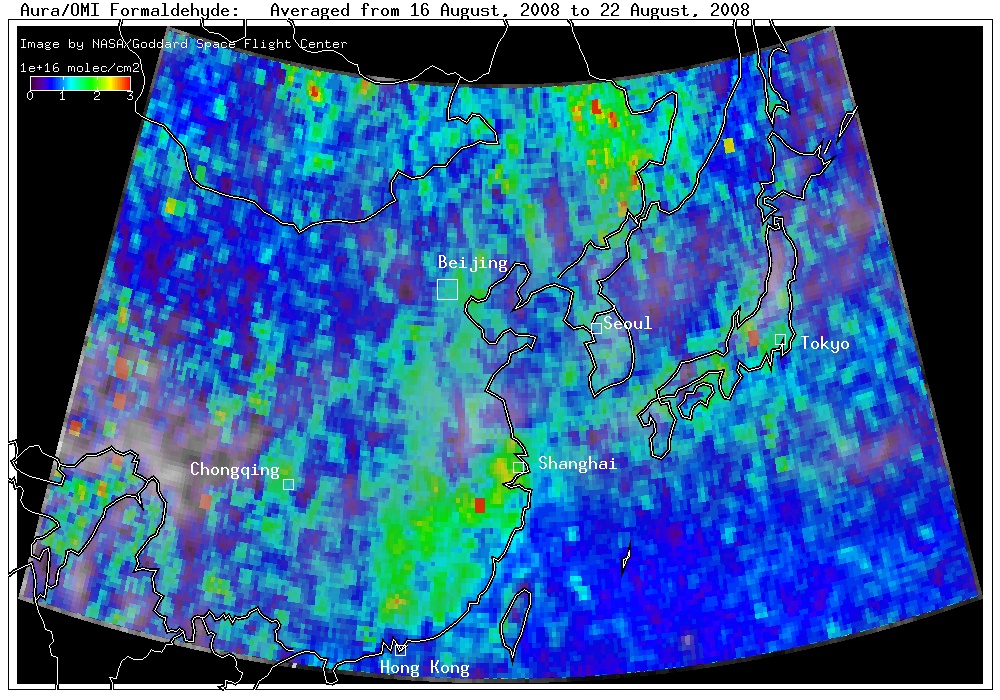
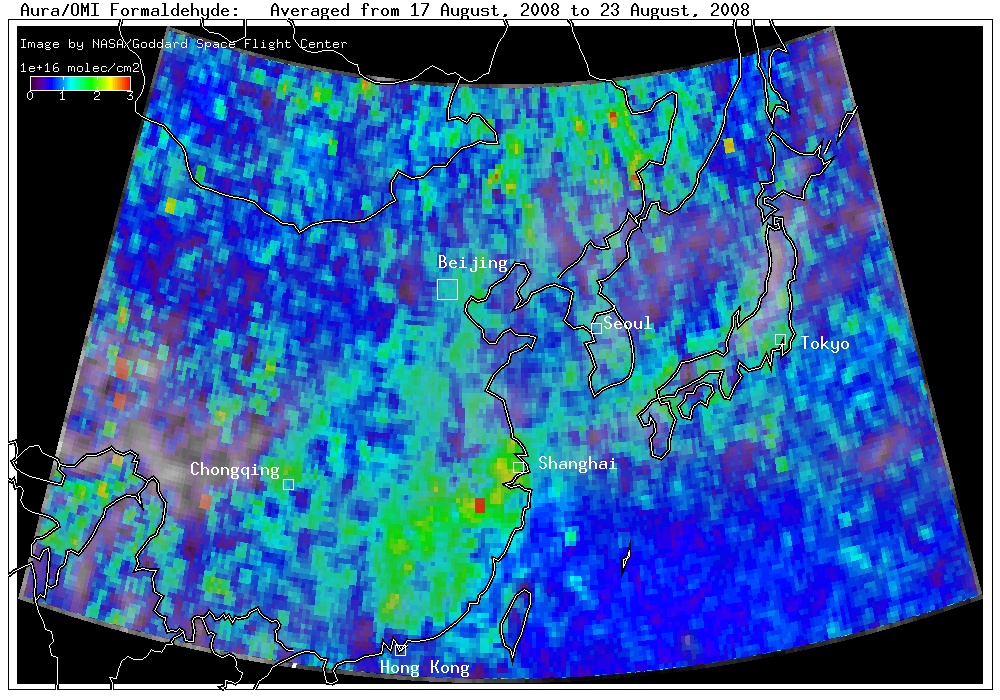
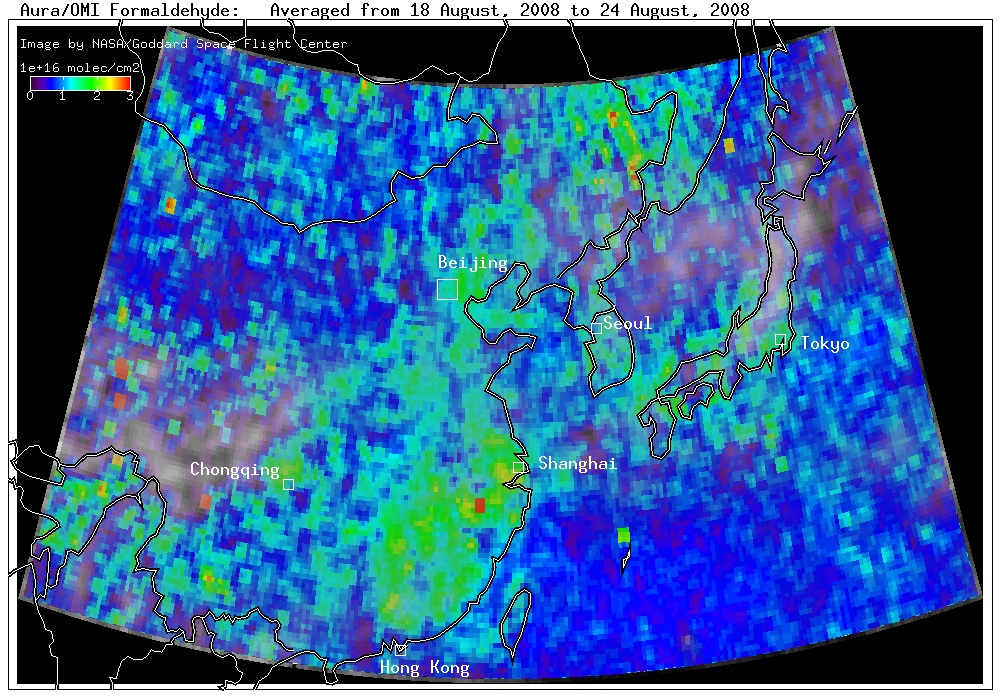
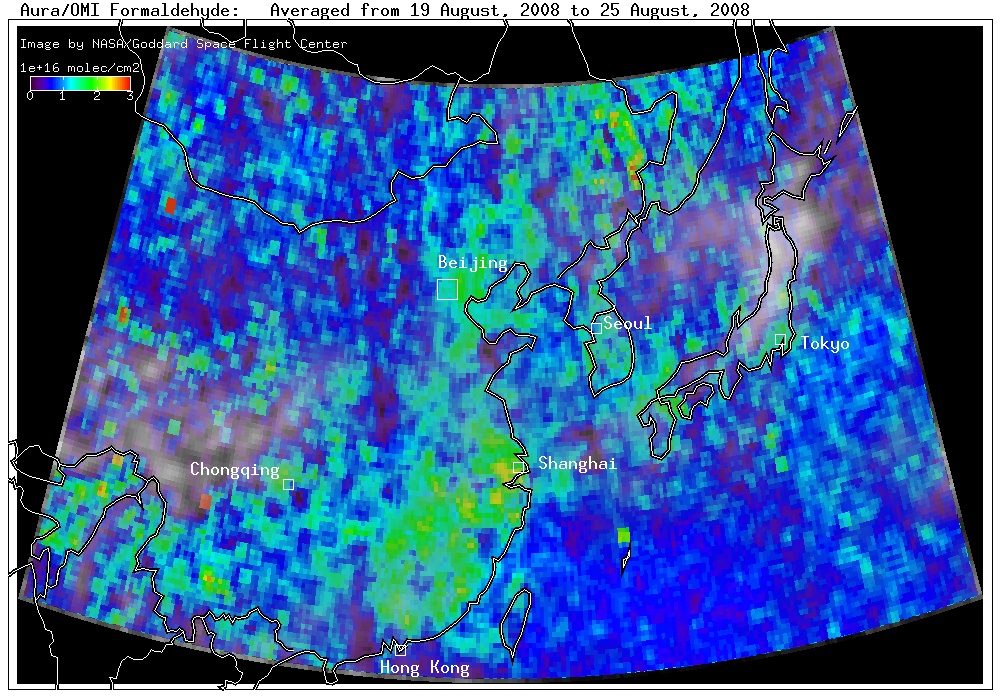
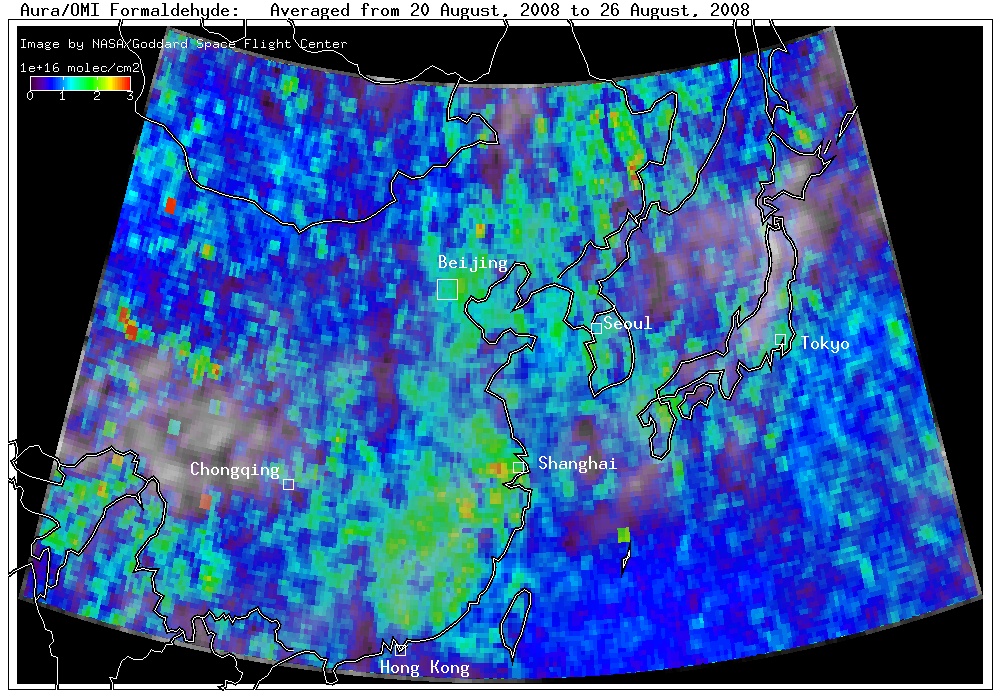
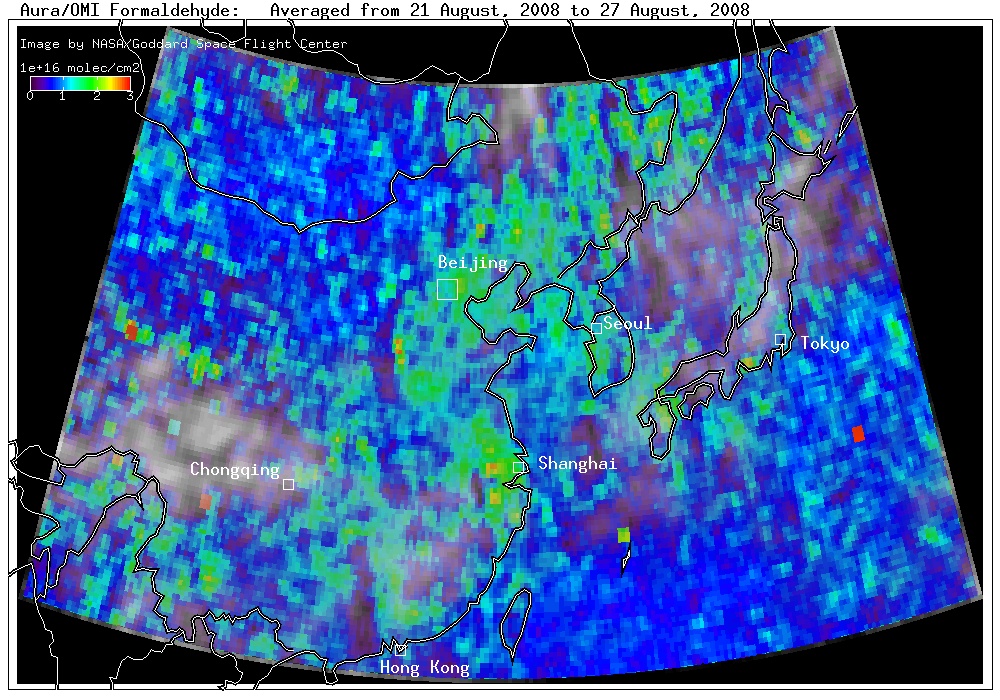
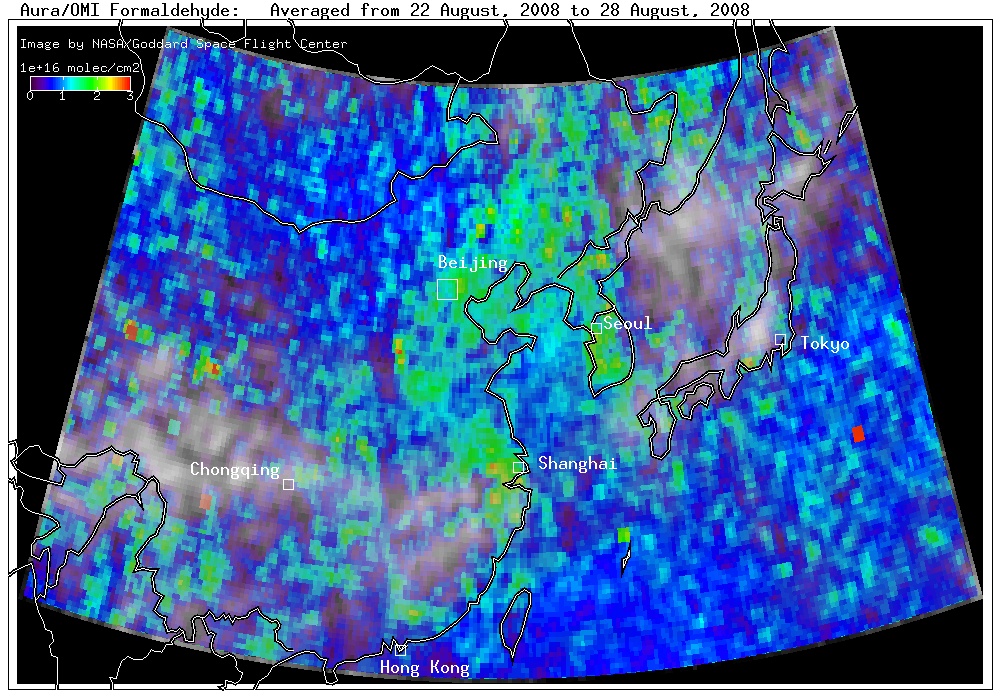
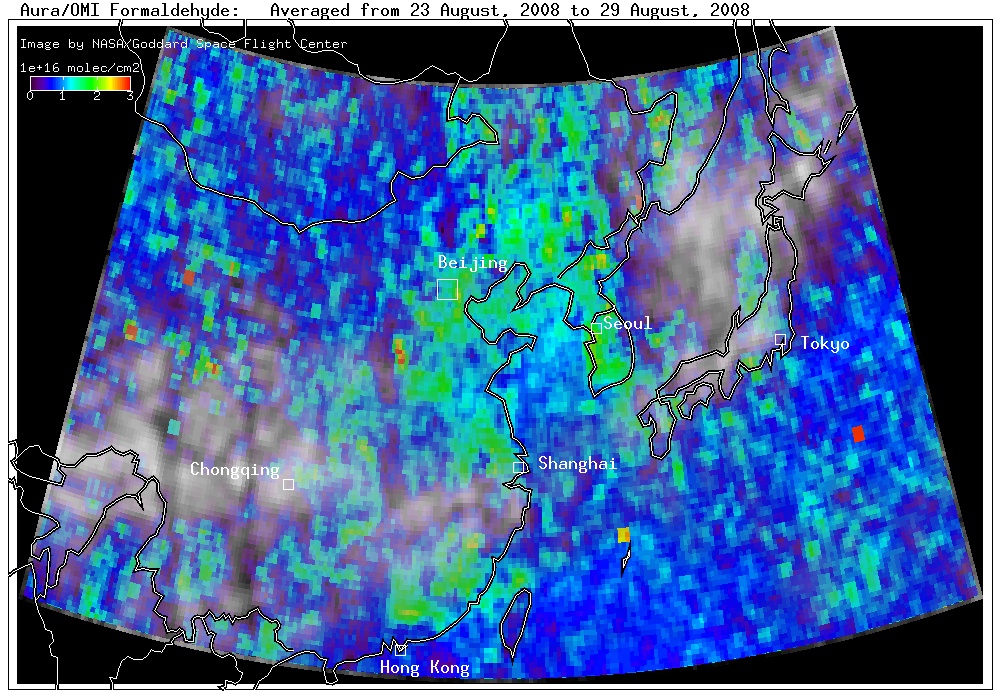
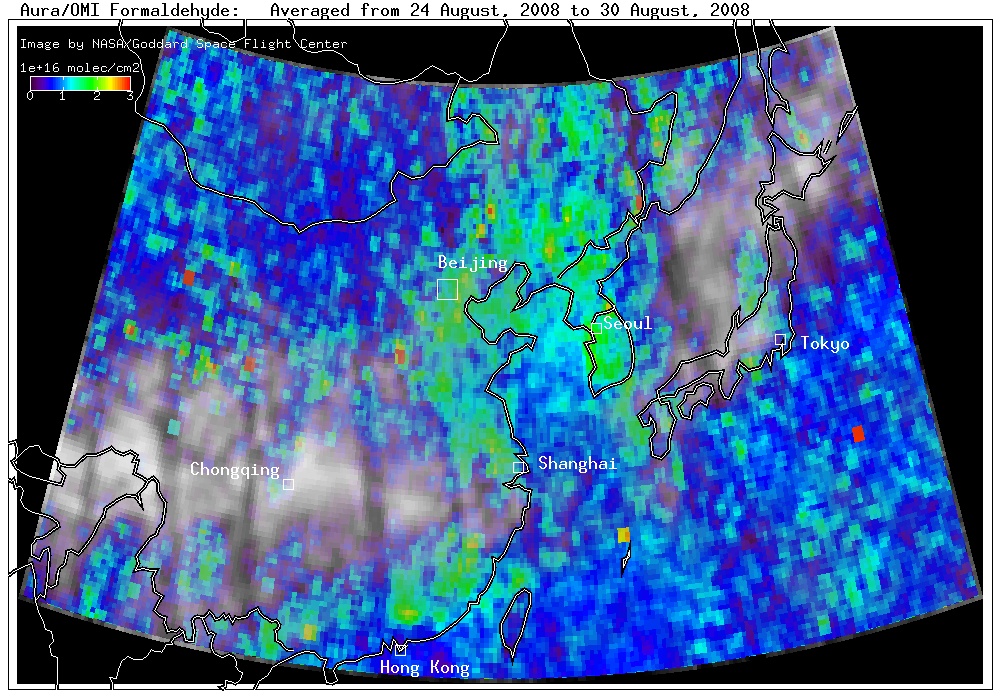
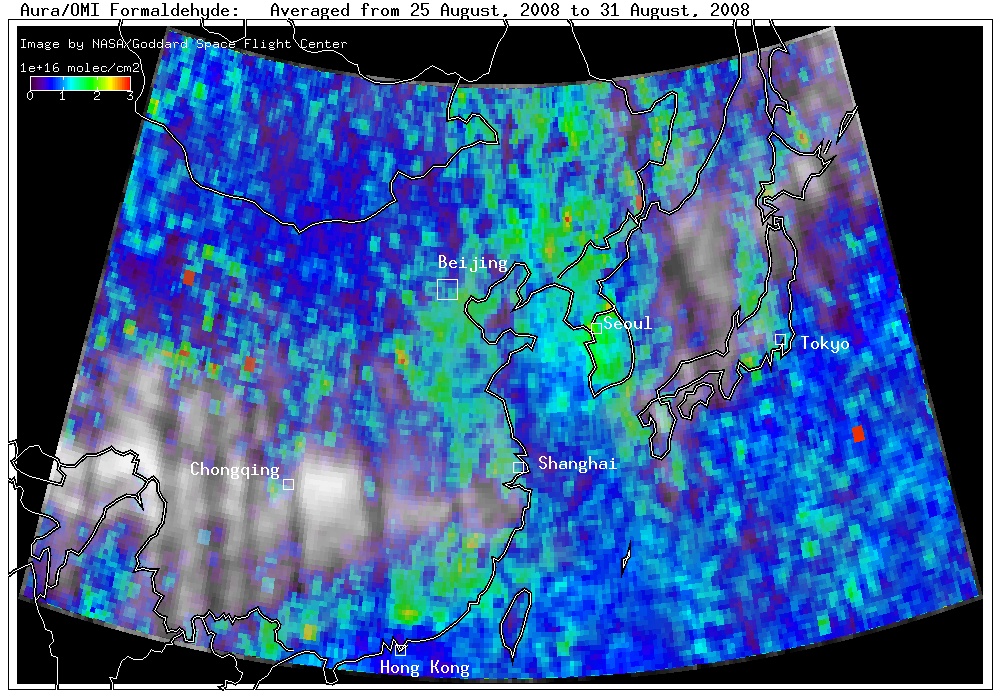
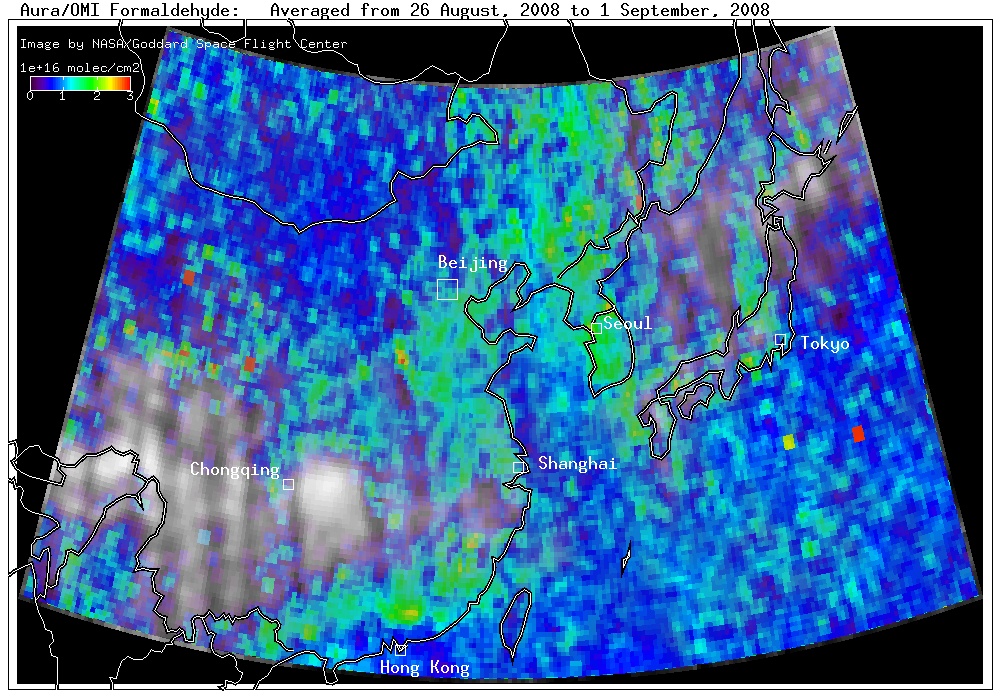
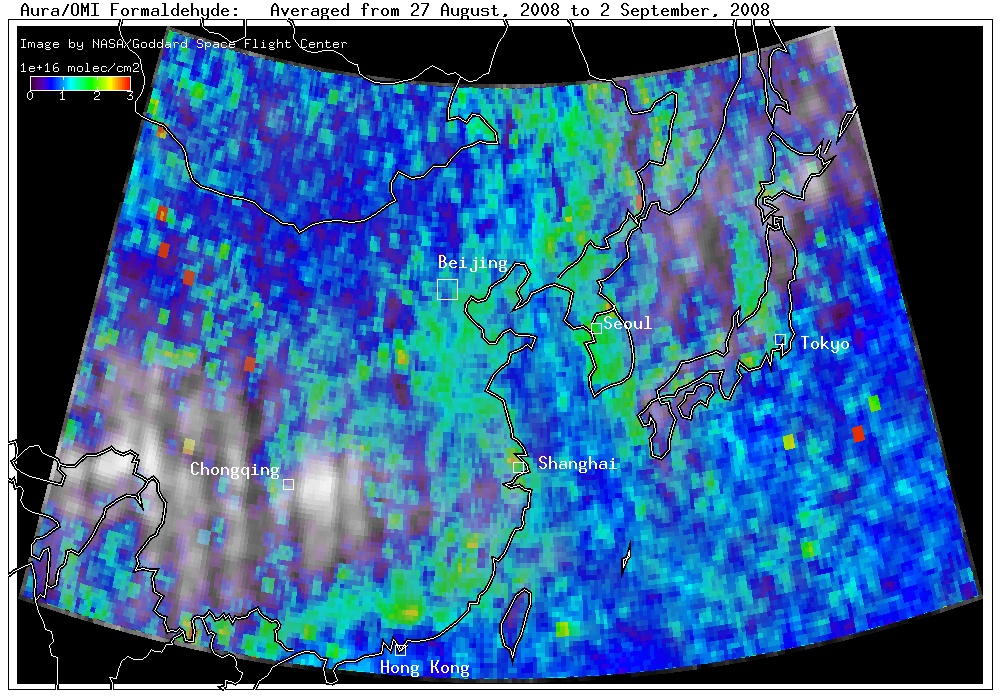
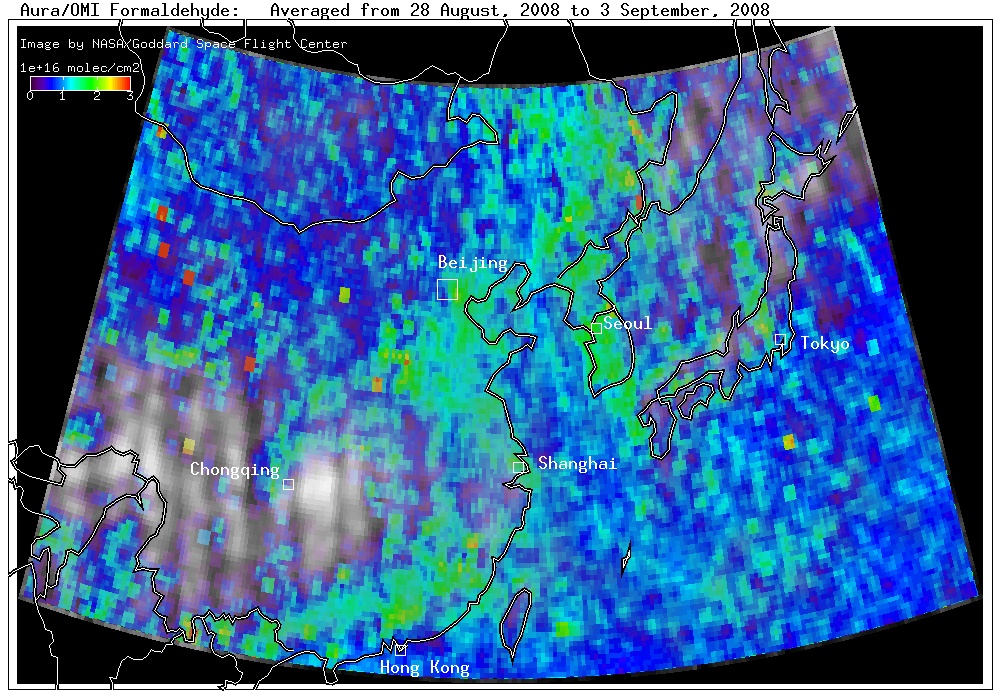
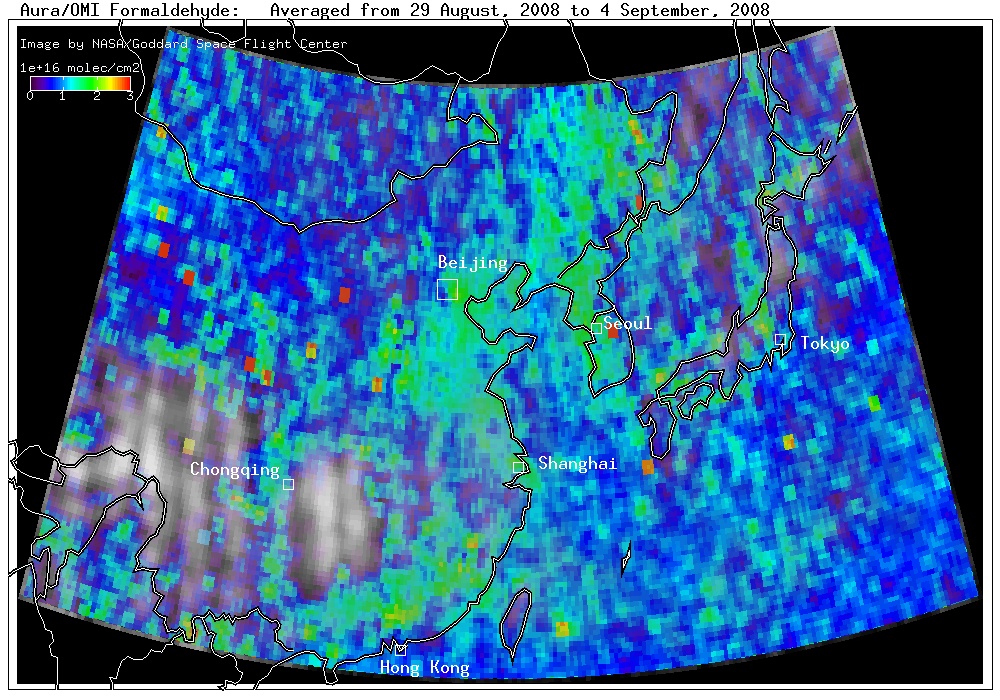
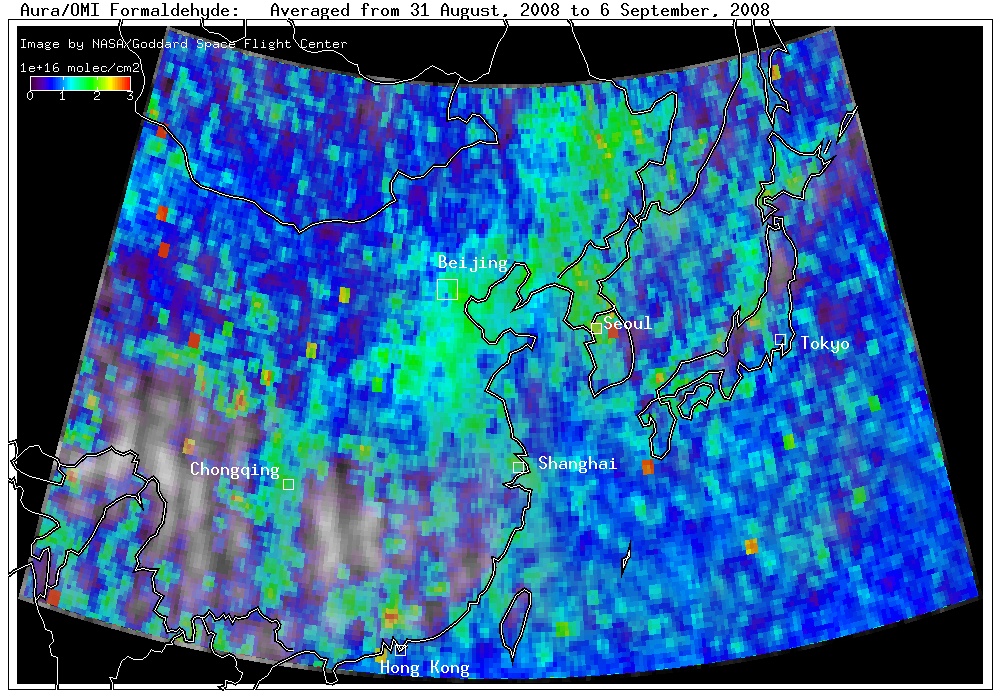
Formaldehyde is a volatile hydrocarbon which reacts with NO2 to form ozone. Large concentrations of formaldehyde are found in the presence of biomass burning regions and industrial sites. OMI can measure formaldehyde in high concentrations such as occur over eastern China.
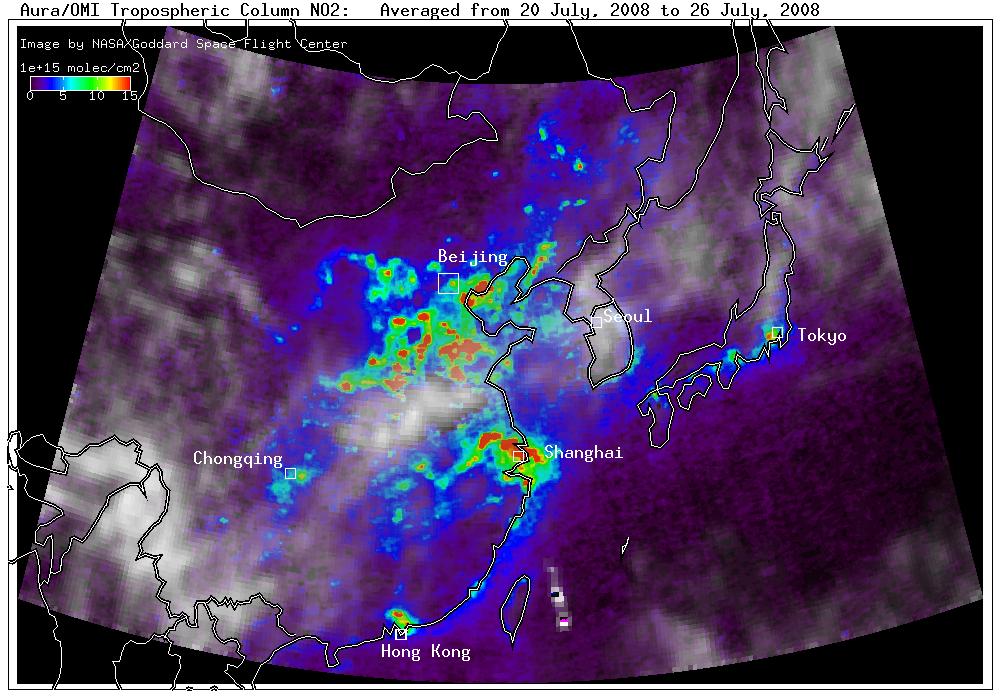
Although we are not seeing much change in SO2 there appears to be a reduction in NO2 after Aug 8, approximately when the Olympics start. SO2 is a longer lived gas and more likely to be blown in from more distant regions. NO2 is short lived and is less sensitive to the weather conditions. The figures show about a 30%-50% reduction in NO2 after August 8. Even though pollution controls were put in place on July 20. Additional controls may have been implimented at the start of the Olympics.
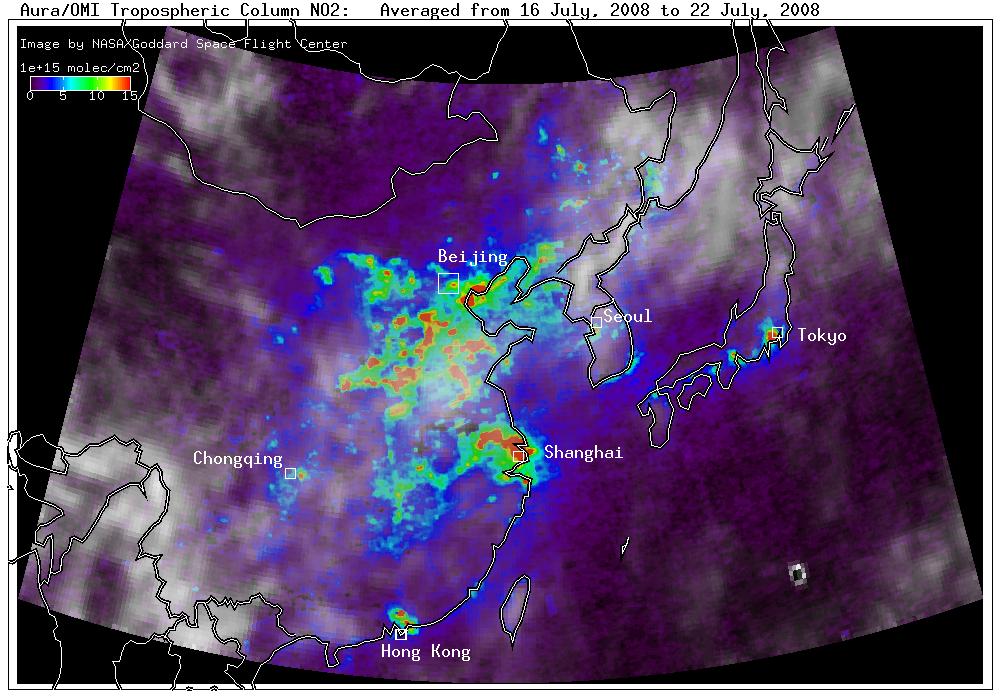
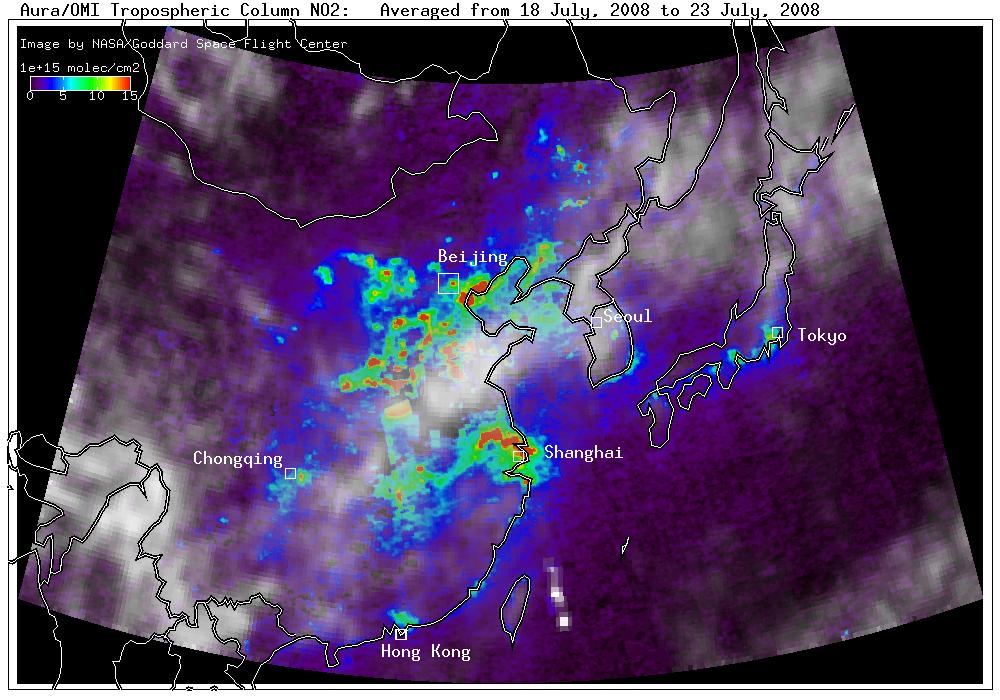
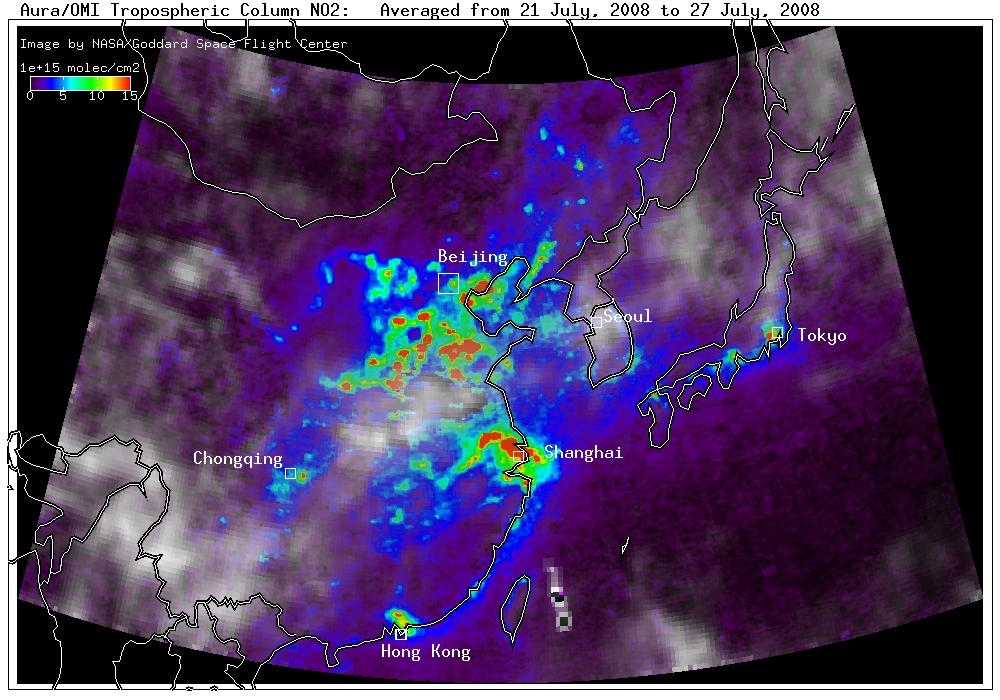
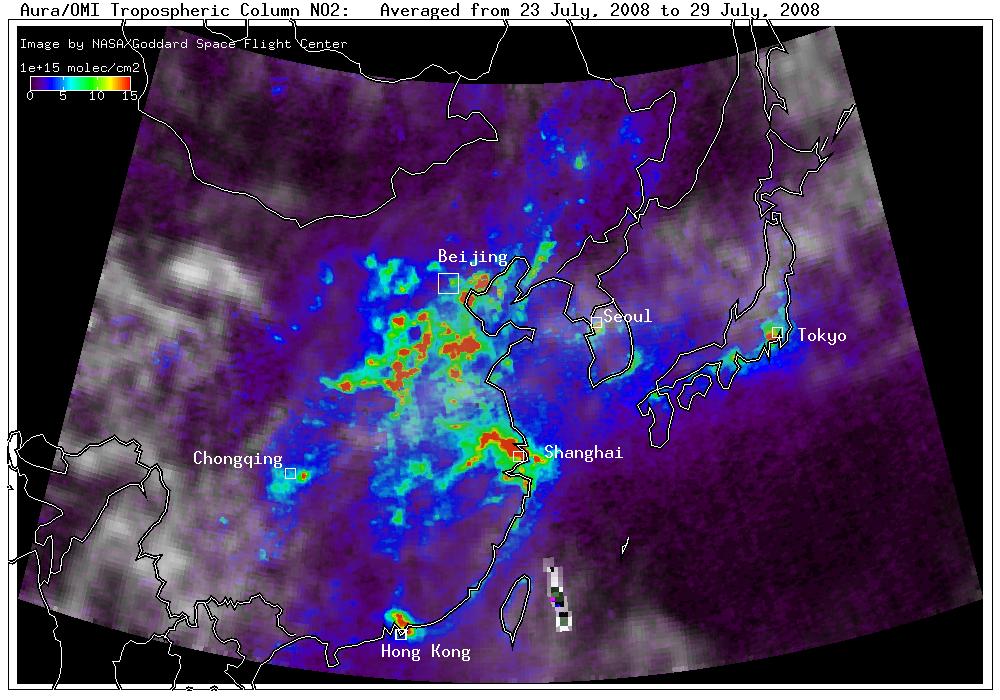
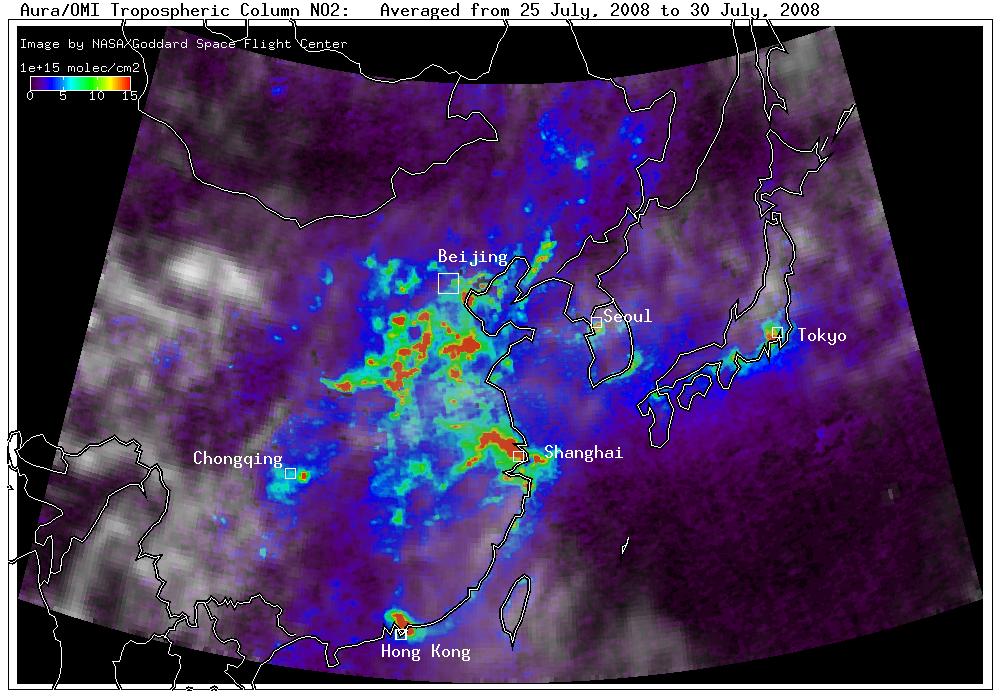
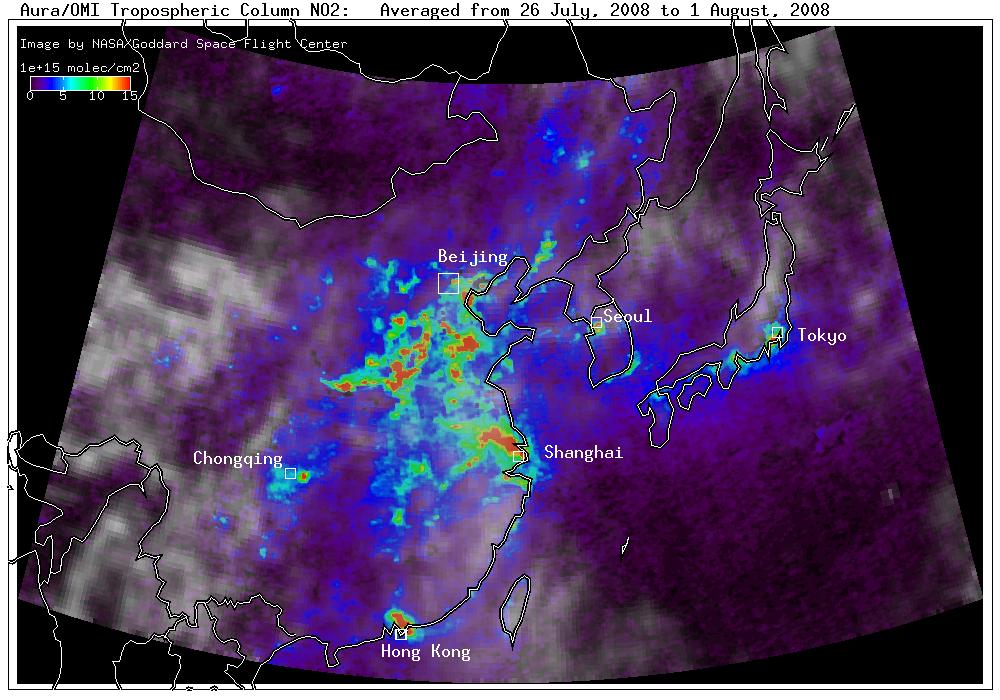
OMI tropospheric NO2 observations averaged from July through August 2008. NO2 is an important precursor for tropospheric ozone, which is harmful to human health and certain vegetation. Mean cloudiness is shown with shades of gray to white (white indicating the most clouds).
Each of the still images listed below show a seven day observation of the collected OMI Tropospheric Column of Nitrogen Dioxide. Click on each for a closer view of which locations hold the most concentrated NO2
OMI boundary layer SO2 observations averaged averaged from July through August 2008. Highest SO2 is typically located to the south and southwest of Beijing in regions with large clusters of power plants. Mean cloudiness is shown with shades of gray to white (white indicating the most clouds).
Each of the still images listed below show a seven day observation of the collected OMI Tropospheric Column of Sulfur Dioxide. Click on each for a closer view of which locations hold the most concentrated SO2
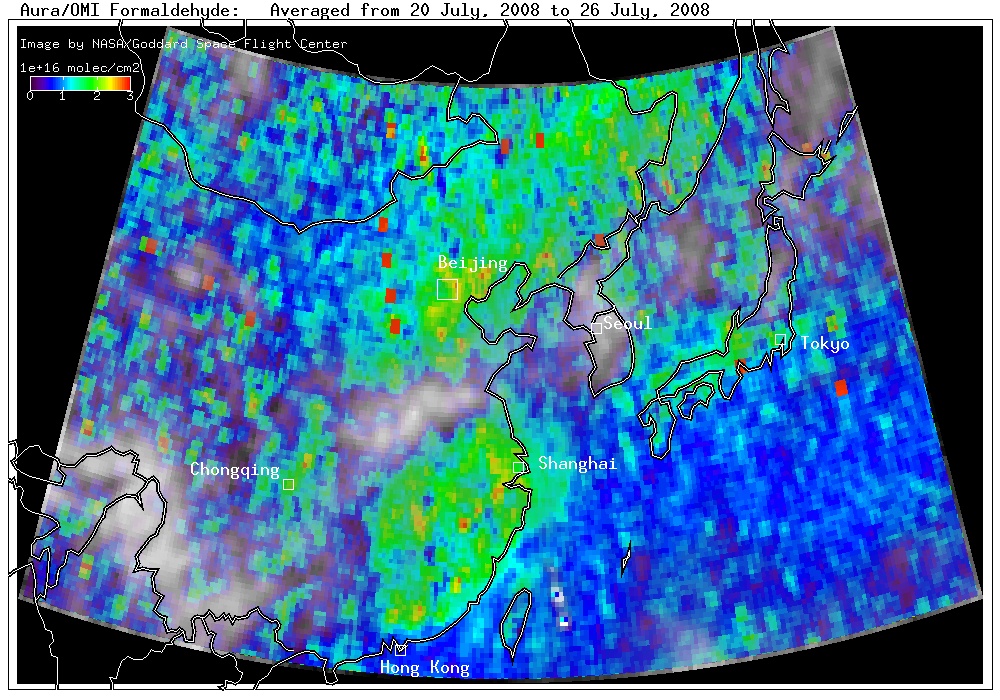
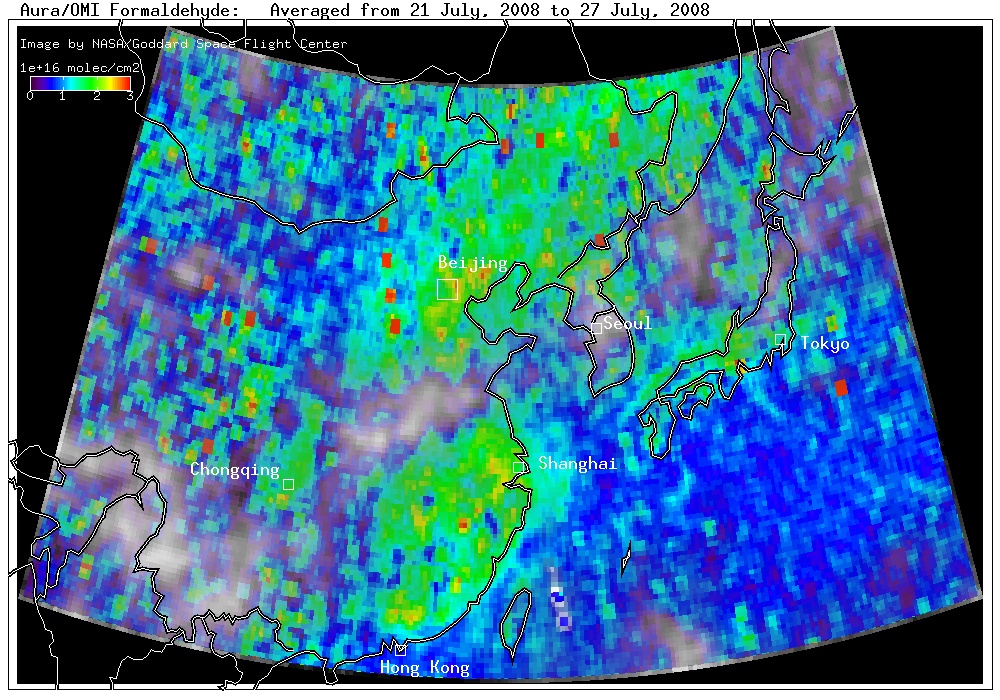
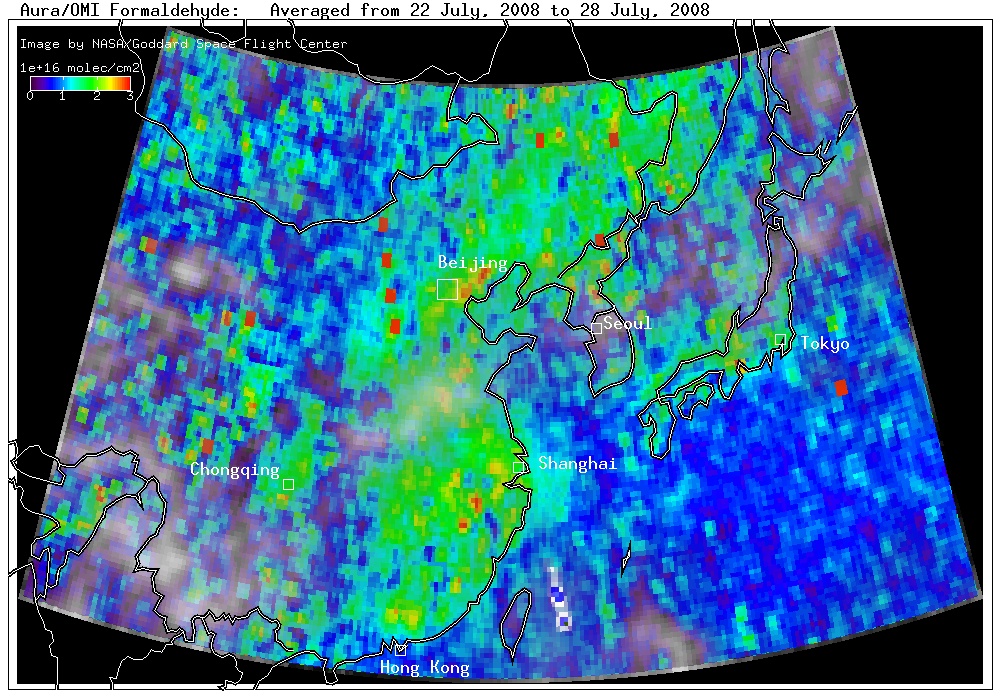
Formaldehyde (HCHO) is a volatile hydrocarbon which reacts with NO2 to form ozone. Large concentrations of formaldehyde are found in the presence of biomass burning regions and industrial sites. OMI can measure formaldehyde in high concentrations such as occur over eastern China.
Each of the still images listed below show a seven day observation of the collected OMI Formaldehyde measurements. Click on each for a closer view of which locations hold the most concentrated HCHO .
12.16.2008
