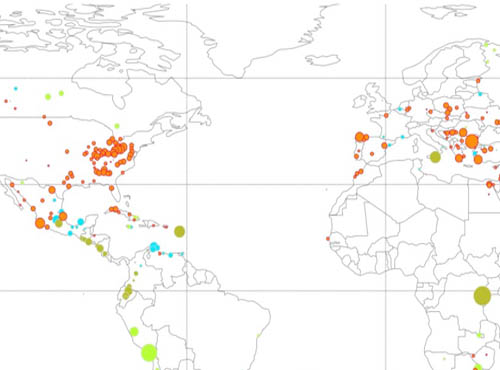
 Combined catalogue of sulfur dioxide emissions
Sulfur dioxide measurements from three satellite instruments (OMI-OMPS-TROPOMI) were used to update and extend the previously developed global catalogue of large anthropogenic sulfur dioxide emission sources and degassing volcanoes
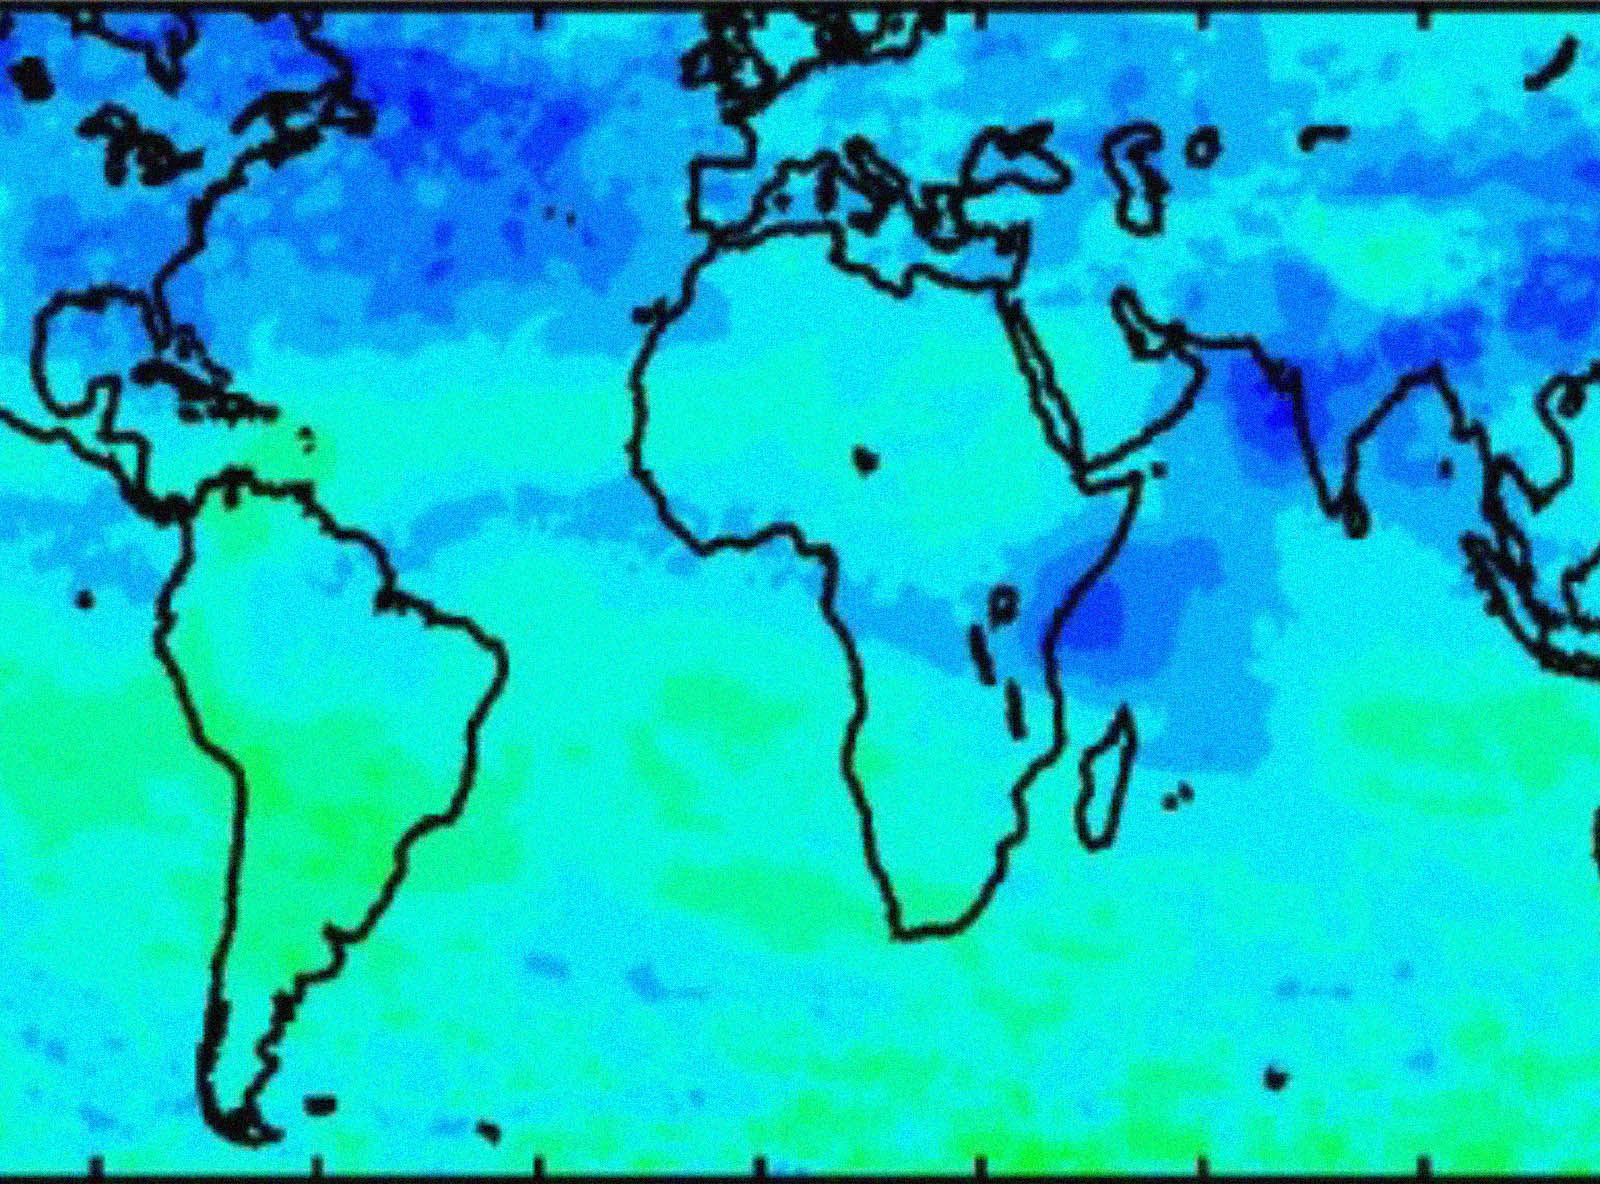 NASA satellite measurements show global-scale reductions in tropospheric ozone in 2020 and again in 2021 during COVID-19
The COVID-19 pandemic created global scale reductions in anthropogenic sources of pollution including important tropospheric ozone precursors such as nitrogen oxides and Volatile Organic Compounds.
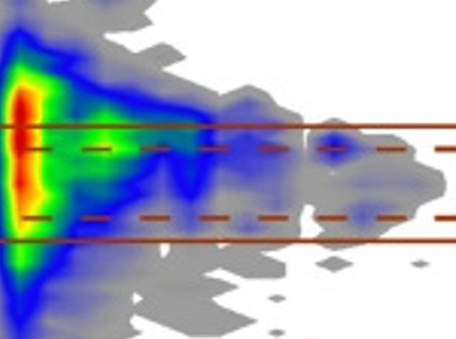 UV-VIS Spectral Aerosol Absorption
This Dataset from AERONET-OMI-MODIS Synergy measuring spectral aerosol absorption remains a challenging task in aerosol studies, especially in the UV region, where ground and airborne measurements are sparse.
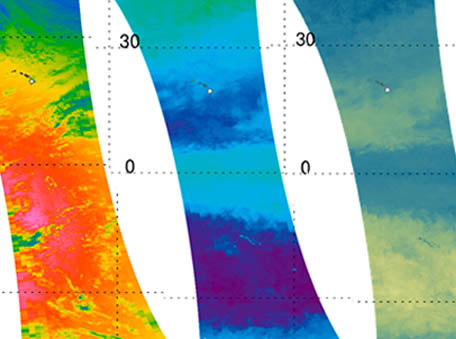 Hyperspectral Underwater UV Irradiances
The combination of Aqua MODIS and Aura Ozone Monitoring Instrument (OMI) data with a radiative transfer model estimate the penetration depths of solar UV radiation into global ocean.
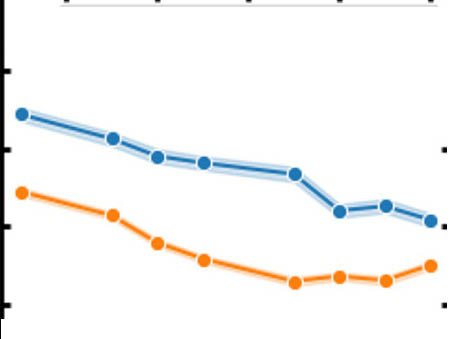 Spatial and Temporal Variation of near Surface Hydroxyl Radical in North American Cities
Combining Machine Learning and Ozone Monitoring Instrument (OMI) Data to fully measure the hydroxyl radical (OH) which is is the primary cleansing agent in the atmosphere. The abundance of OH in cities initiates the removal of local pollutants; therefore, it serves as the key species describing the urban chemical environment.
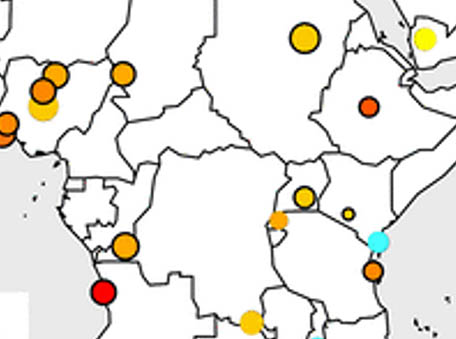 Rapid rise in premature mortality due to anthropogenic air pollution in fast-growing tropical cities from 2005 to 2018
Tropical cities are experiencing rapid growth but lack routine air pollution monitoring to develop prescient air quality policies.
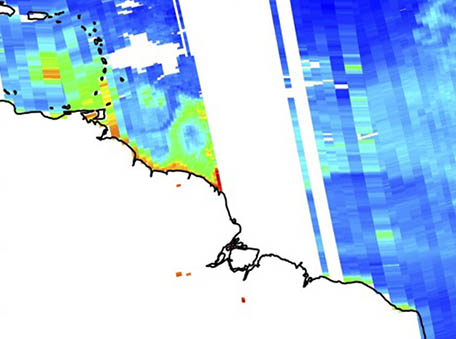 Using Machine Learning for Timely Estimates of Ocean Color Information from Hyperspectral Satellite Measurements in the Presence of Clouds, Aerosols, and Sunglint
We have developed a new technique to estimate ocean color properties under less-than-ideal retrieval conditions including clouds, aerosols, and sunglint.
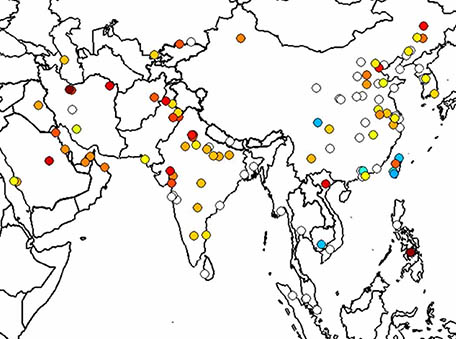 Aura OMI formaldehyde data show significant anthropogenic VOC trends in Asian cities over 2005–2019
Trends of formaldehyde linked to anthropogenic activity over large cities located in the Asian continent were calculated for the period 2005–2019 using the Quality Assurance for Essential Climate Variables dataset from the Aura Ozone Monitoring Instrument (OMI).
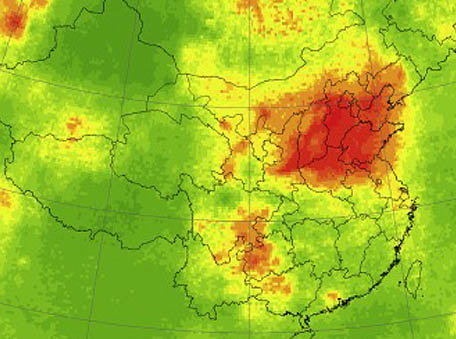 Long-term ambient sulfur dioxide concentration and its exposure risk across China inferred from Aura OMI observations from 2005 to 2018
Although the Sulfur dioxide exposure risk in 2018 decreased significantly from 2005 on a national scale, 80% and 17% of people still faced a high exposure risk in the North China Plain and Northwest China, respectively
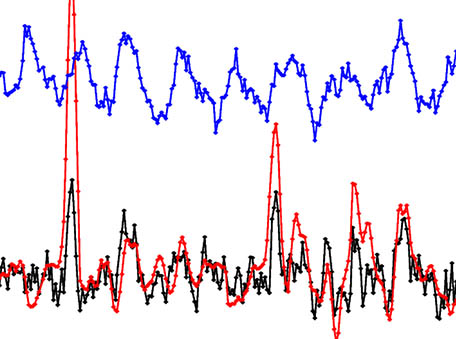 Solar activity and responses observed in Balmer lines
 Daily solar irradiance measurements from Aura Ozone Monitoring Instrument (OMI) and TROPOMI show that some prominent Fraunhofer lines behave differently from the majority of UV-visible spectral transitions. This finding may ultimately help in deciphering the complex stellar-activity patterns in the search for exo-planets, which requires precise characterization of intrinsic variability patterns of the hosting stars to discriminate planetary signals.
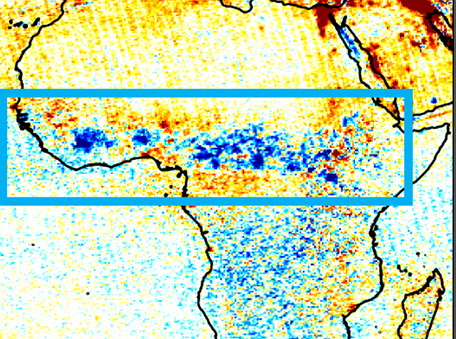 Reductions in nitrogen dioxide burden over north equatorial Africa from decline in biomass burning in spite of growing fossil fuel use
 Ozone Monitoring Instrument (OMI) and MODerate-resolution Imaging Spectroradiometer (MODIS) data reveal that a decline in biomass burning has led to lower dry season tropospheric NO2 concentrations in north equatorial Africa, counter to what is expected for economically growing low- and middle-income regions.
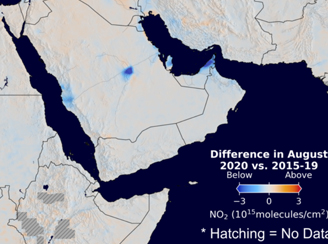 Impact of COVID-19 on Pilgrimage to Mecca as Assessed with Aura Ozone Monitoring Instrument (OMI) Nitrogen Dioxide
Nitrogen Dioxide is an air pollutant and is primarily emitted from burning of fossil fuels (diesel, gasoline, coal) while driving cars and generating electricity.
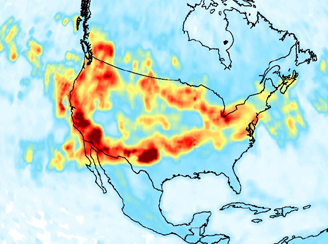 Near Ultraviolet Observations of the 2020 U.S. Wildfire Season
Unprecedented amounts of pollution were produced by multiple fires over the USA west coast in September 2020. Continental scale smoke plumes from these wildfires were observed by the Ozone Monitoring Instrument (OMI) on the Aura satellite for about five weeks since the onset of the fires in early September.
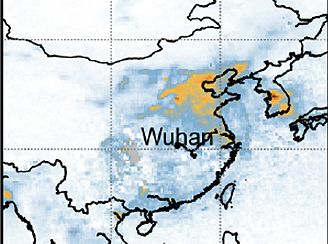 Abrupt decline in tropospheric nitrogen dioxide over China after the outbreak of COVID-19
 Aura's Ozone Monitoring Instrument (OMI) used in evaluating the reduction of nitrogen dioxide tropospheric vertical column densities before and after the Lunar New Year.
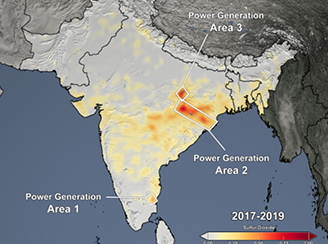 Reductions in Sulfur Dioxide & Nitrogen Dioxide Air Pollution over South Asia Associated with Efforts to Control the Spread of COVID-19
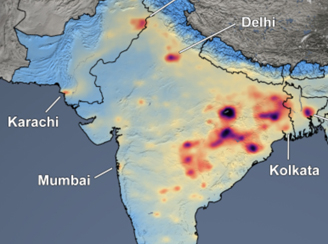
As a consequence of the nationwide stay-at-home order, less fossil fuels are being consumed and, subsequently, less air pollution is being emitted in India and also in neighboring countries, including Pakistan, Nepal, Bangladesh, and Sri Lanka.
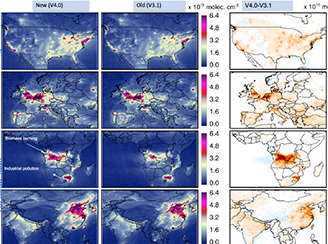 New Generation Nitrogen Dioxide Standard Product
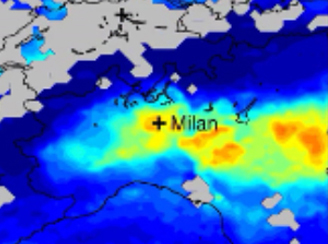
 The NASA standard nitrogen dioxide version 4.0 product for Aura's Ozone Monitoring Instrument (OMI) incorporates the most salient improvements and enhances the data quality.
 New Nitrogen Dioxide Web-based Monitoring System to Facilitate Scientific Research
 To facilitate scientific research using Aura's OMI nitrogen dioxide data, the team at developed a web-based monitoring system that shows time series for over 200 world cities and animated maps for larger regions.
 Reductions in Nitrogen Dioxide Air Pollution Presumably Associated with Reductions in Fossil Fuel Use
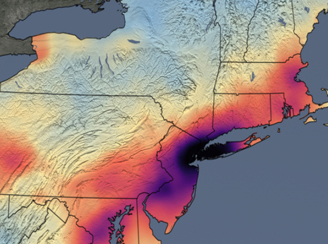
The Northeast US has seen significant reductions in air pollution over its major metropolitan areas as communities grapple with widespread lockdowns and shelter-in-place orders as a result of the spread of COVID-19.
 Reductions in Sulfur Dioxide & Nitrogen Dioxide Air Pollution over South Asia Associated with Efforts to Control the Spread of COVID-19
 Aura's OMI data over South Asia show the means of the period in previous years, while the comparing to the means for 2020, showing a vast improvement after the nationwide stay-at-home order for India’s 1.3 billion citizens.
 A Methodology To Constrain Carbon Dioxide Emissions From Coal-fired Power Plants Using Observations Of Co-emitted Nitrogen Dioxide
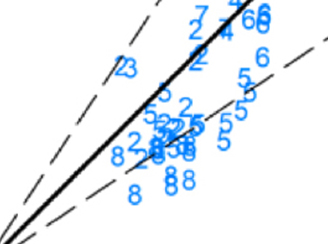
 Satellite-derived emission estimates are based on NO2 measurements from the Aura Ozone Monitoring Instrument (OMI).
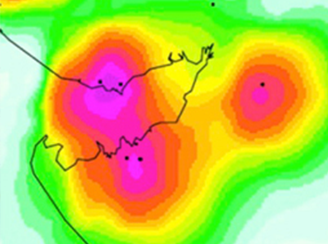 Ceramic industry at Morbi as a large source of sulfur dioxide pollution in India
Observations from the Ozone Monitoring Instrument (OMI), onboard the NASA's Earth Observing System (EOS) Aura satellite, reveal a large Sulfur dioxide pollution
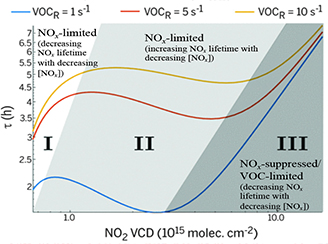 A shifting lifetime for nitrogen oxides
 Aura Ozone Monitoring Instrument Direct Observation of Changing Nitrogen oxide Lifetime in North American Cities
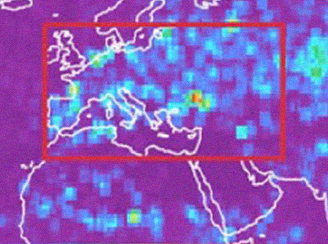 Mid-latitude lightning nitrogen oxides production efficiency
 Inferred from Ozone Monitoring Instrument and World Wide Lightning Location Network (WWLLN) data
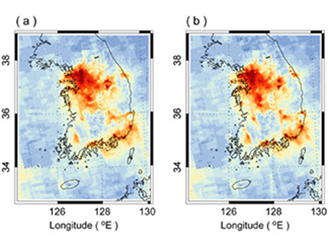 Spatial Downscaling of Nitrogen Dioxide Data
 Over the last few years, a number of researchers have applied various techniques (e.g., land-use regression models) to create finer-scale Aura OMI NO2 data for use in research. Two recent studies are highlighted here.
 The importance of accounting for the free tropospheric Nitrogen Dioxide background
 Using satellite observations of tropospheric Nitrogen Dioxide columns to infer long-term trends in US nitrogen oxide emissions.
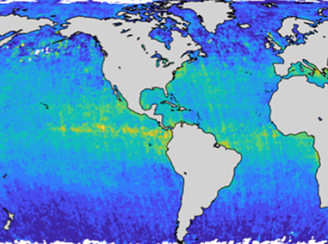 Mapping the Oxidizing Capacity of the Global Remote Troposphere
 This new product represents a novel application of existing satellite data and will help us better interpret contemporary trends in the budgets of methane (a potent greenhouse gas) and ozone (a major pollutant and oxidant source).
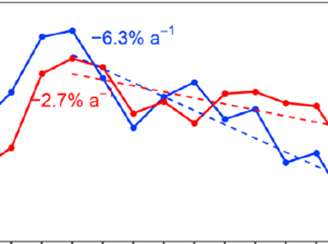 OMI Tracks Changes in Mexico's Offshore Gas Flaring Activity
Gas flaring from Mexico's offshore oil fields leads to economic loss and emissions of air pollutants and greenhouse gases, and there are global efforts to reduce gas flaring.
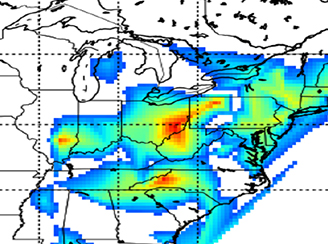 OMI Links Decrease in Acid Deposition to Emission Reduction in the Eastern U.S.
Introducing a new method using OMI observations to attribute decrease in acid deposition to SO2 emission reduction
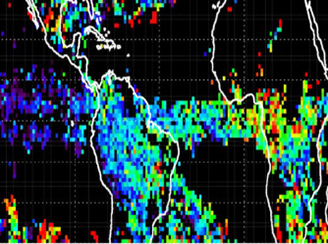 The Nature of Ozone in Deep Convective Clouds As Measured from Aura OMI/MLS
OMI satellite measurements reveal for the first time many key features of ozone variability inside deep convective clouds
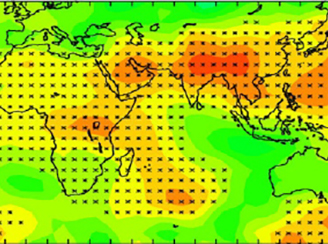 Trends in Global Tropospheric Ozone Inferred from a Composite Record of TOMS/OMI/MLS/OMPS Satellite Measurements and the MERRA-2 GMI Simulation
OMI satellite measurements identify increases in tropospheric ozone over Saudi Arabia/India/Southeast Asia and other global regions
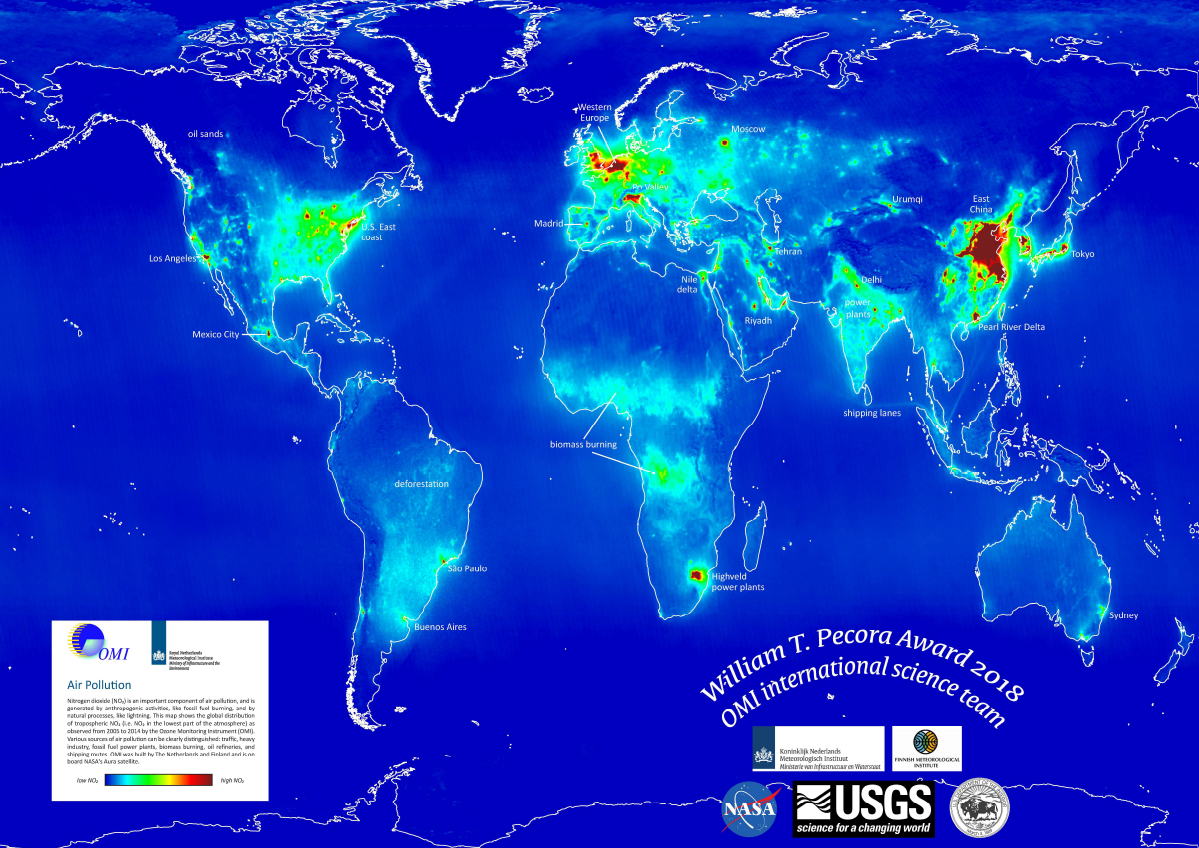 Aura OMI International Team Awarded USGS 2018 Pecora Award
 The Ozone Monitoring Instrument (OMI) International Team, consisting of Dutch, Finnish and American scientists, was awarded the 2018 William T. Pecora Award by the USGS.
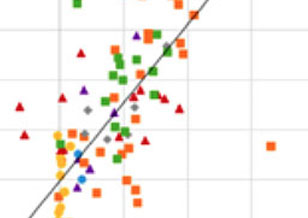 Nitrogen Dioxide Data to Show A Relationship Between Air Quality Changes & Economic Growth Globally
 Satellites offer an unprecedented opportunity to evaluate patterns and trends in air pollution, especially in regions with few or no ground-based monitors.
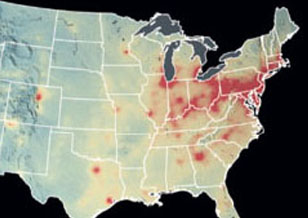 The 2018 National Academies' Decadal Survey Highlights Aura Data to Demonstrate the Power of Satellite Data for Science & Societal Benefit
 In "Thriving on Our Changing Planet: A Decadal Strategy for Earth Observation from Space”, Aura data were presented as examples of satellite observations used as a global monitoring system for air quality & health and stratospheric ozone.
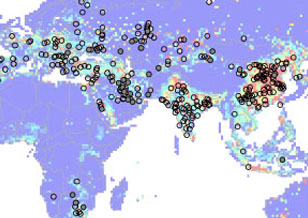 New Global Anthropogenic Sulfur Dioxide Emission Inventory
 Sulfur dioxide measurements from the Ozone Monitoring Instrument (OMI) satellite sensor have been used to detect emissions from large point sources. Emissions from over 400 sources have been quantified individually based on OMI observations, accounting for about a half of total reported anthropogenic SO2 emissions.
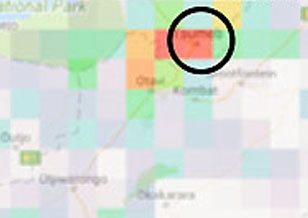 Application of sulfur dioxide observations supporting the cleantech industry's goal of reducing air pollution
 In this study, we present the result of the application of space-based sulfur dioxide (SO2) observations to evaluate the efficacy of cleantech solutions in reducing air polluting emissions from metal smelting.
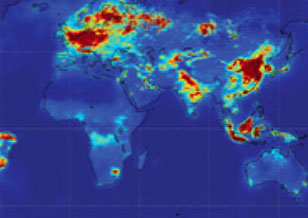 Ambient Surface Nitrogen Dioxide and Effects Globally on Asthma Exacerbation and Incidence
 Asthma is the most prevalent chronic respiratory disease worldwide, affecting 358 million people in 2015. Ambient air pollution exacerbates asthma among populations around the world and may also contribute to new-onset asthma.
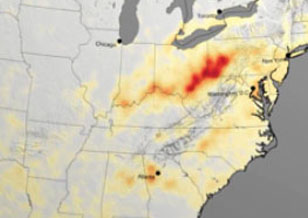 Aura Ozone Monitoring Instrument (OMI) sulfur dioxide & nitrogen dioxide products highlighted in recent air quality trends reports
 OMI data are used in a variety of air quality applications, such as monitoring trends in air pollution.
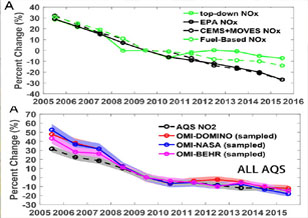 Nitrogen Dioxide Emission Reduction Slowdown Unexpected: Observed by Aura's Ozone Monitoring Instrument (OMI)
 Ground and satellite observations show that air pollution regulations in the United States (US) have resulted in substantial reductions in emissions and corresponding improvements in air quality over the last several decades. However, large uncertainties remain in evaluating how recent regulations affect different emission sectors and pollutant trends.
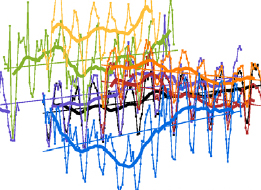 Multiple Aura Datasets Contribute to the Tropospheric Ozone Assessment Report (TOAR)
 In the troposphere, ozone is both a major pollutant and a strong greenhouse gas. Although spaceborne and ground-based observations largely agree on the overall tropospheric ozone loading, estimates of decadal-scale trends vary significantly between datasets.
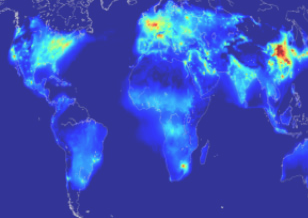 Ozone Monitoring Instrument: 14 years in space
 This overview paper highlights the many ways that Aura Ozone Monitoring Instrument (OMI) data have advanced atmospheric composition research and benefited society.
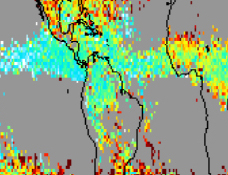 Simulations Demonstrate How Convection & Chemistry Impact Mid-Tropospheric Ozone
 NASA Goddard Earth Observing System Chemistry Climate Model (GEOSCCM) simulations reproduce the tropospheric ozone distribution observed by Aura OMI/MLS. The simulation shows that photochemical production exceeds loss throughout Tropics.
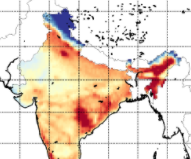 Which processes drive observed variations of Formaldehyde columns over India?
 Formaldehyde (HCHO) plays a role in determining the oxidizing capacity of the global troposphere. The principal source of HCHO is the oxidation of methane (CH4), which provides a global ambient background. Minor direct HCHO sources include biomass burning, industry, agriculture, automobiles, shipping, and vegetation
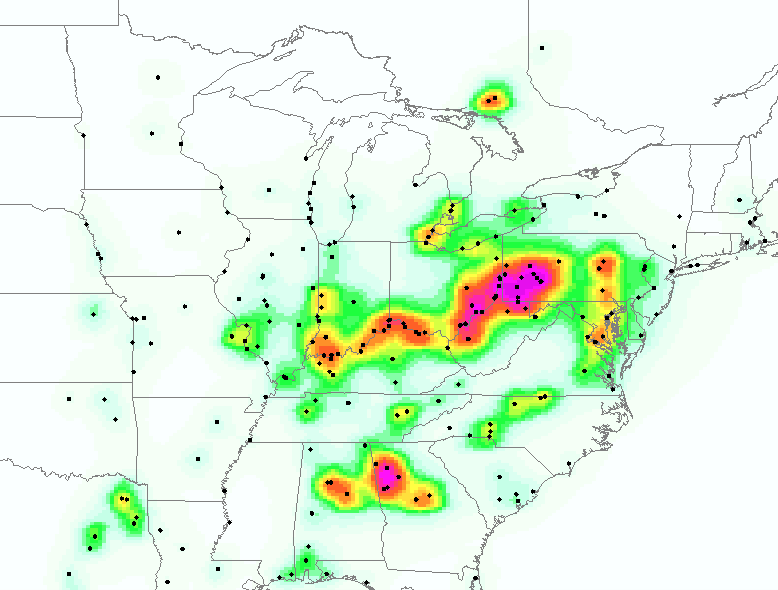 The Relationship Between OMI Sulfur Dioxide Data & Known Emissions Creates A Multi-Decade Record
 Using Aura's Ozone Monitoring Instrument (OMI) sulfur dioxide data collected between 2005-2015, a multi-decade record was produced using prior SO2 emission data from 1980 to the present
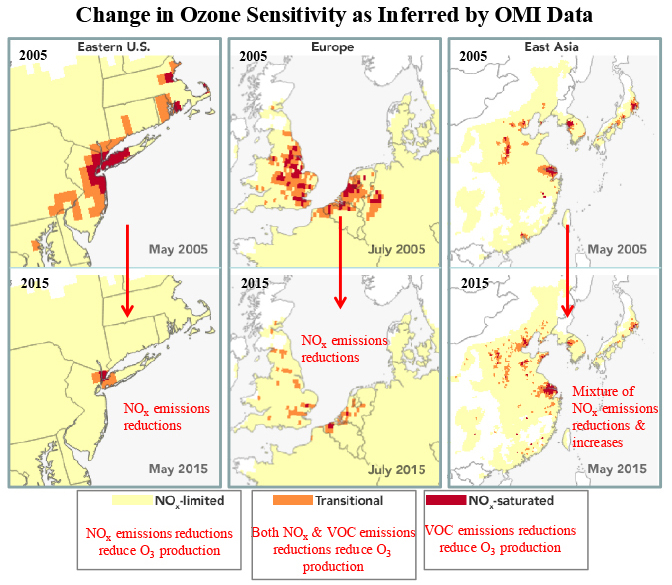
Satellite observations of Aura OMI formaldehyde and Nitrogen Dioxide to identify areas that would benefit more from reducing Nitrogen Oxide emissions versus reducing Volatile Organic Compound emissions.
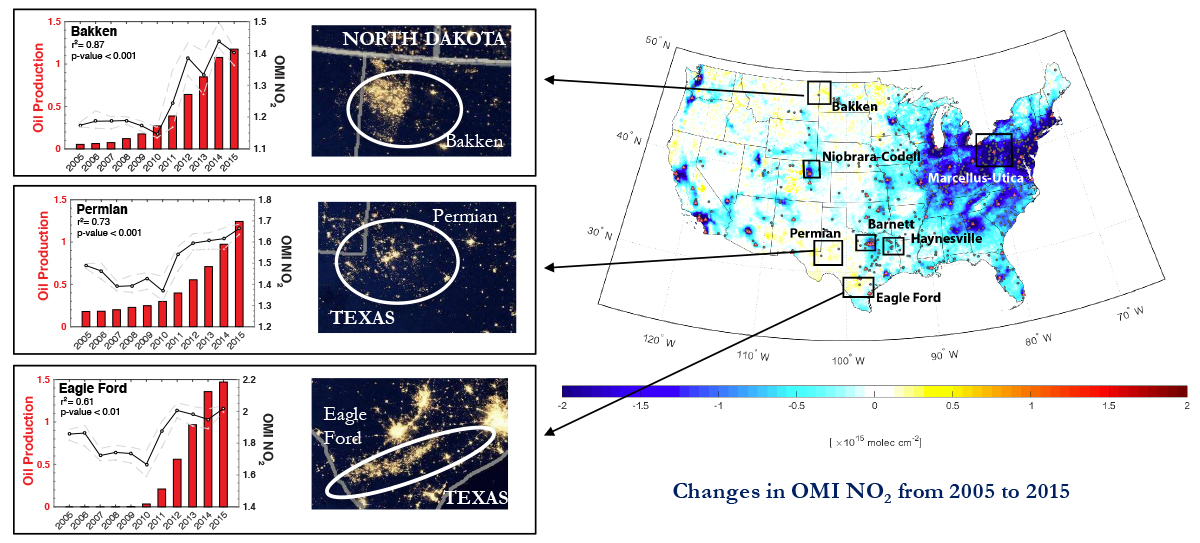
This study shows the effect that shale oil and natural gas operations has had on tropospheric Nitrogen Dioxide levels in the Central Plains, and indicates the potential consequences for regional air quality.
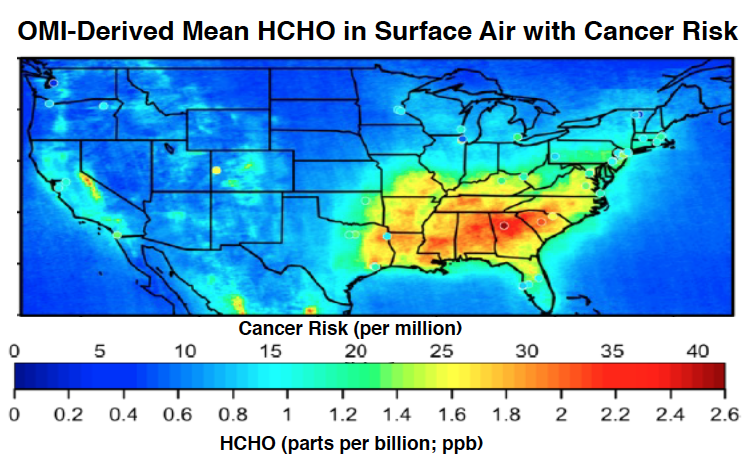
Formaldehyde is the top hazardous air pollutant of concern to EPA. It has a large natural atmospheric source from the oxidation of isoprene, a volatile organic compound emitted from trees, especially in the Southeast US.
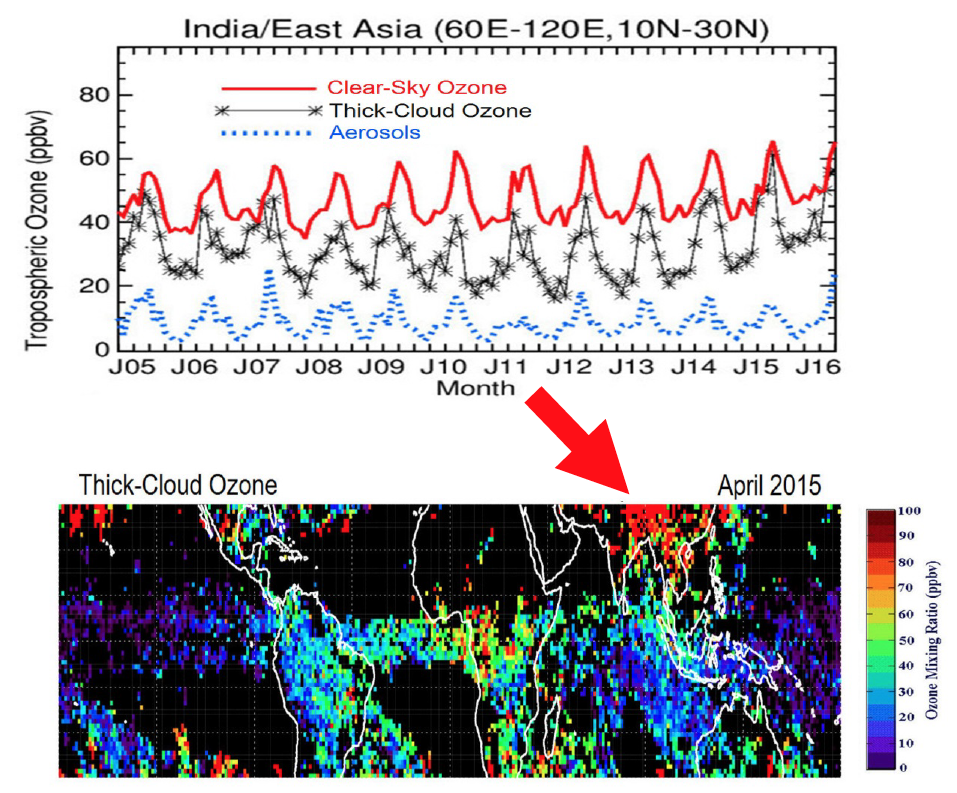
Ozone within deep convective clouds is controlled by several factors involving photochemical reactions and transport. Gas-phase photochemical reactions and heterogeneous surface chemical reactions involving ice, water particles, and aerosols inside the clouds all contribute to the distribution and net production and loss of ozone.
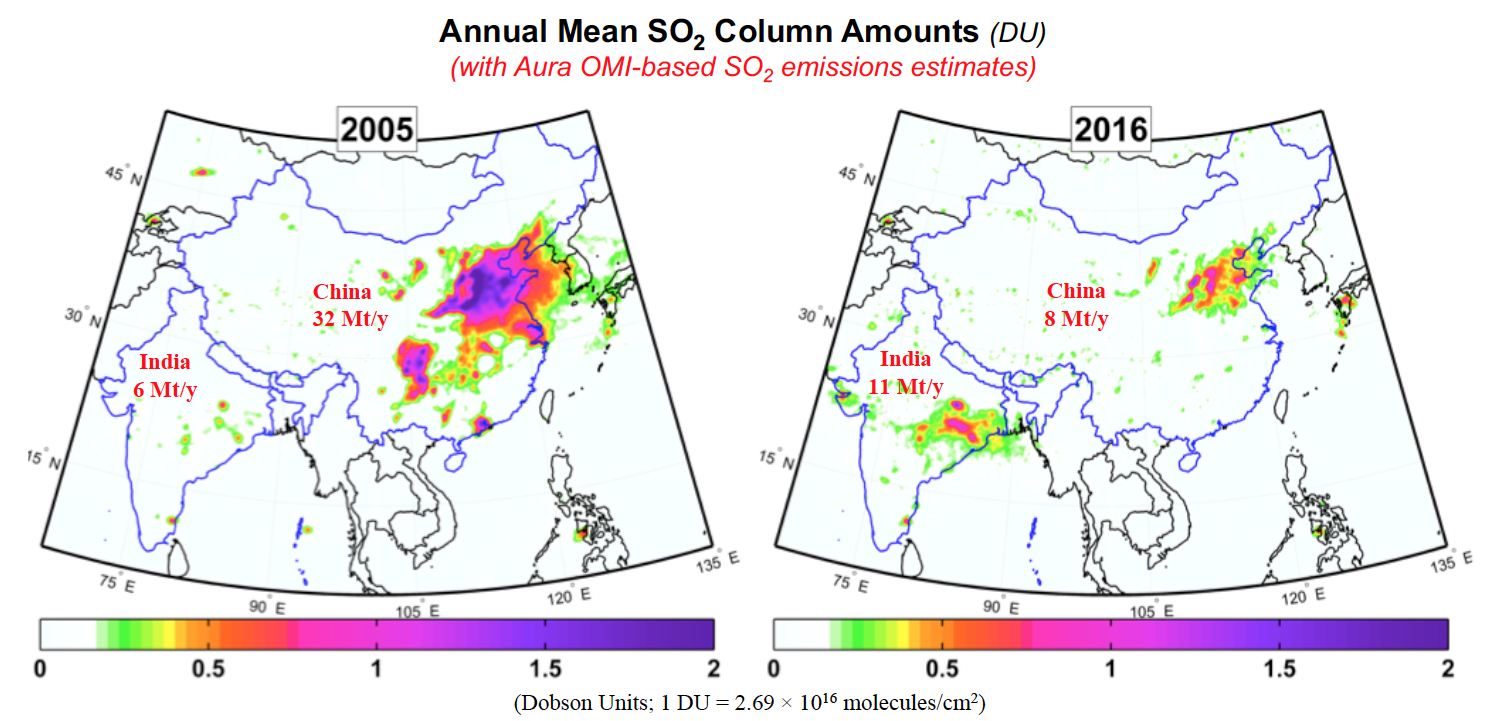
Sulfate commonly makes up >10% of the fine particles in China and India, often much more during heavy pollution episodes. To predict and mitigate air pollution, air quality models require accurate information on the emissions of SO2 and other pollutants.
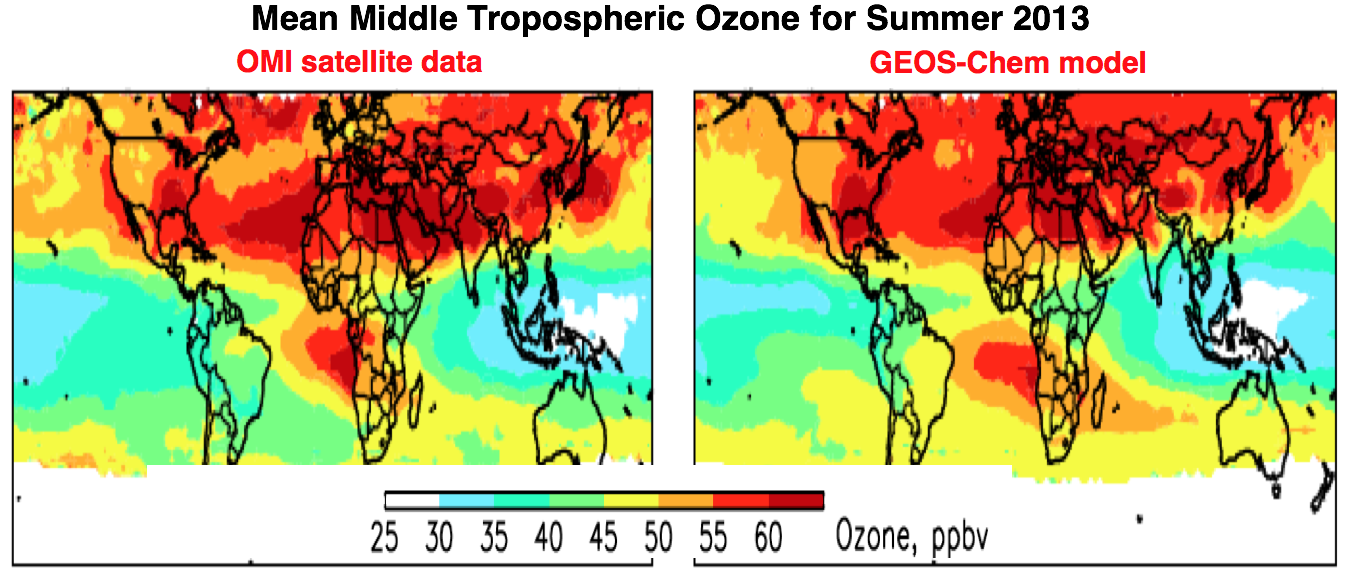
Tropospheric ozone is an important climate gas and an air pollutant. It plays a major role in tropospheric chemistry, such as serving as the main source for the hydroxyl radical, the atmosphere's primary oxidant.
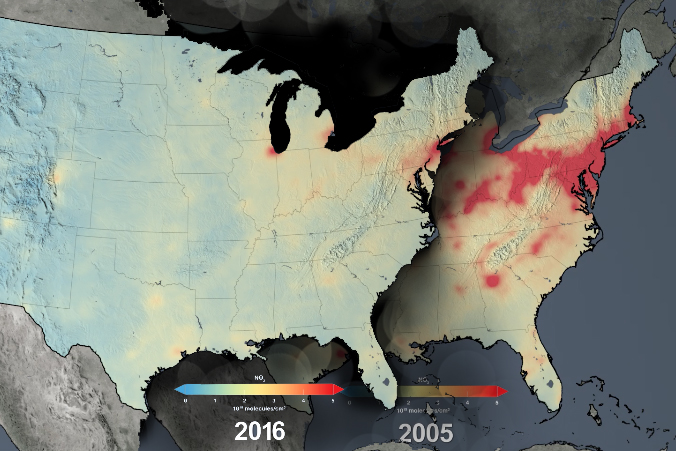
The Ozone Monitoring Instrument (OMI) animation of observations of decreasing nitrogen dioxide
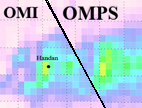
From the Ozone Monitoring Instrument to the Ozone Mapping Profiler Suite : As Aura has entered the stage of extended mission and OMI has lost part of its spatial coverage due to instrument issues, it is critical to continue the global anthropogenic sulfur dioxide record with new instruments.
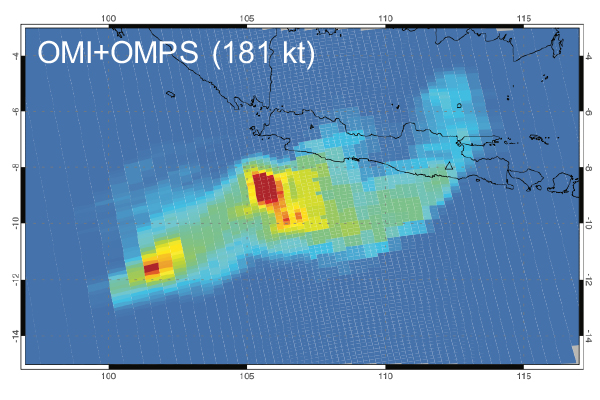
As compared with the previous OMI data product, this new version significantly reduces retrieval bias for large volcanic eruptions and improves data quality for small degassing volcanoes.
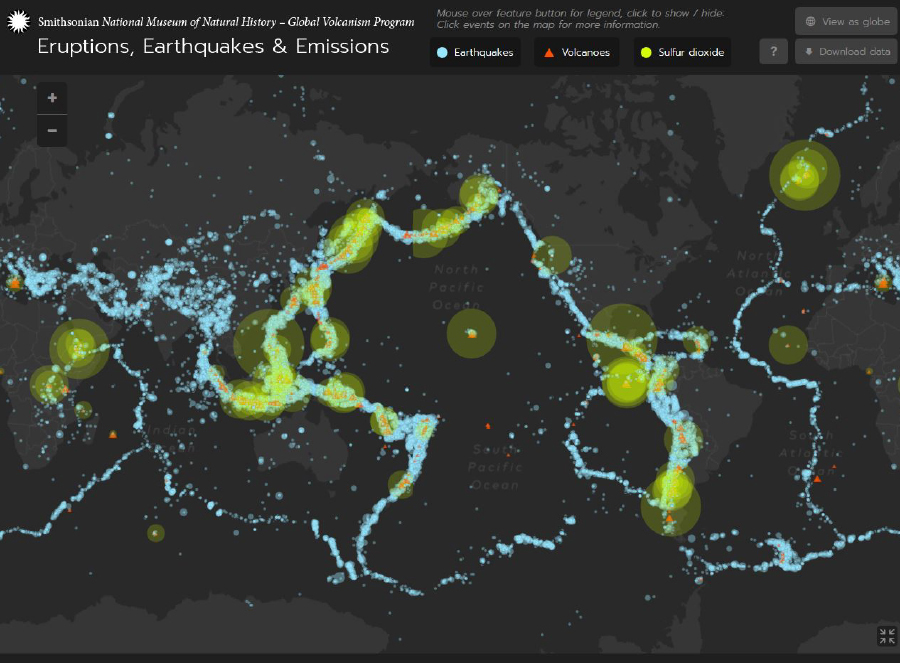
The Global Volcanism Program at the Smithsonian Institution National Museum of Natural History has created a new Eruptions, Earthquakes and Emissions web visualization using NASA volcanic sulfur dioxide data from multiple satellites.
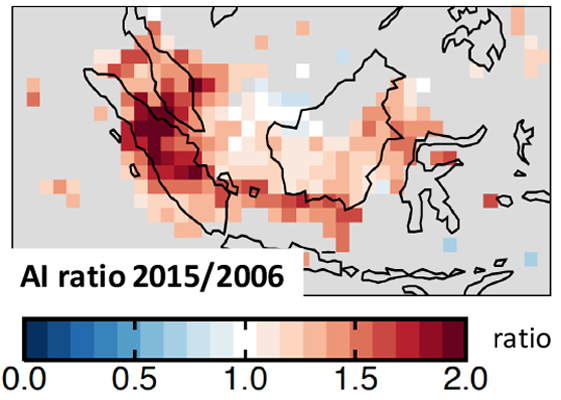
GEOS-Chem adjoint study estimates ~100,000 premature deaths in Equatorial Asia due to severe, persistent smoke from the El Niño fires.
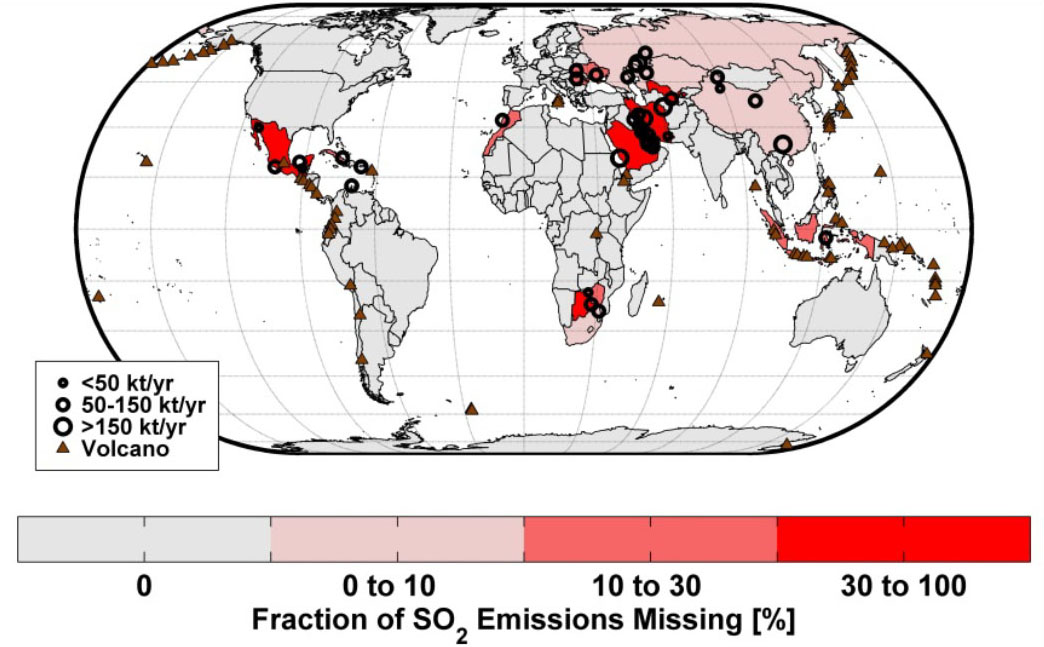
A new emission-source detection algorithm was applied to the measurements of sulfur dioxide from the Ozone Monitoring Instrument. It was used to compile the first global, satellite-based emissions inventory, and is completely independent of conventional information sources.
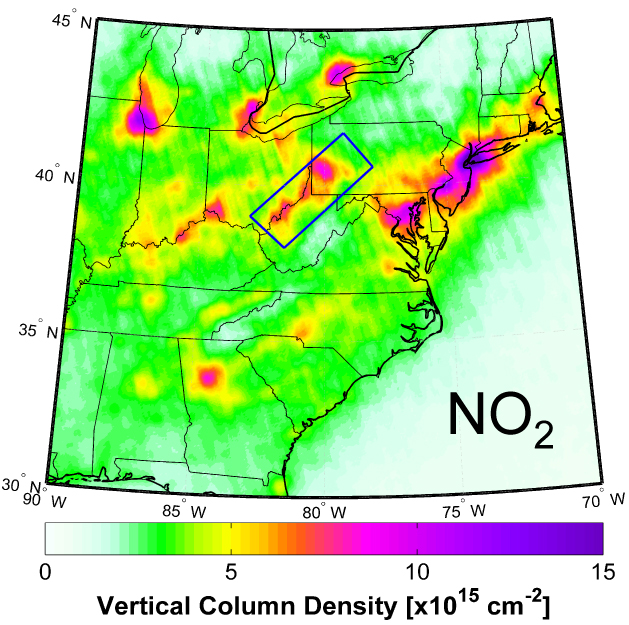
OMI instrument data shows nitrogen dioxide and sulfur dioxide changes over time.
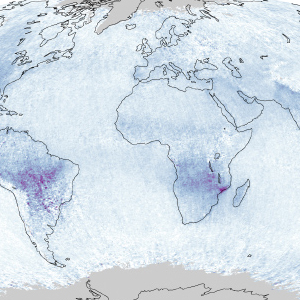
While some forests emit volatile organic compounds that are involved in ozone pollution, history shows attempts to control smog have a better chance of succeeding by focusing on vehicle emissions.
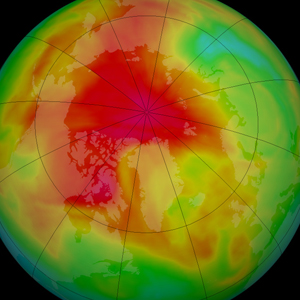
Though Earth's ozone layer has been depleted over the past four decades by chlorofluorocarbons (CFCs) and similar chemical compounds, the changes are expressed differently at the North and South Pole.
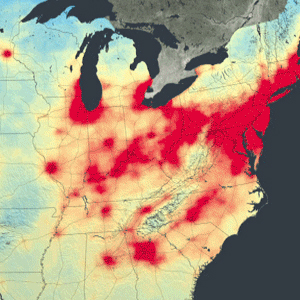
After ten years in orbit, the Ozone Monitoring Instrument (OMI) has been in orbit sufficiently long to show that people in major U.S. cities are breathing less nitrogen dioxide--a yellow-brown gas that can cause respiratory problems.
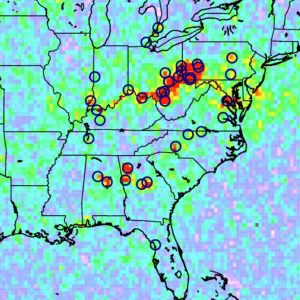
Sulfur dioxide (SO2), emitted from both man-made and volcanic activities, significantly impact air quality and climate. Advanced sensors including the Ozone Monitoring Instrument (OMI) have been employed to measure SO2 pollution.
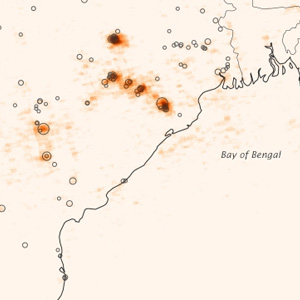
The analysis of data captured by the Ozone Monitoring Instrument (OMI) found that emissions of sulfur dioxide from Indian power plants have increased by more than 60 percent between 2005 and 2012.
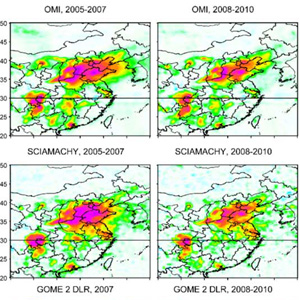
Satellite mapping of sulfur dioxide (SO2) is useful to track volcanic and anthropogenic emissions in places where detailed SO2 emission information is not available.

Data from the Ozone Monitoring Instrument (OMI) show distinct enhancements in nitrogen dioxide (NO2) and sulfur dioxide (SO2 ) over a region of surface mining in the Canadian oil sands.
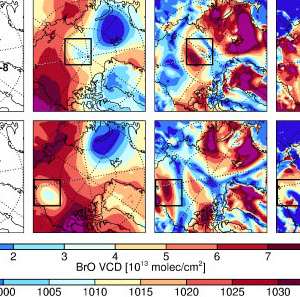
OMI, with its wide swath, is the only instrument that can detect Bromine Monoxide (BrO) at the pole on every orbit. Here, stratospheric BrO has been carefully separated from the total column to produce estimates of the tropospheric BrO column.
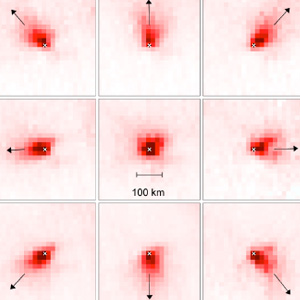
Emission inventories in megacities are uncertain, particularly in developing countries. Can we use OMI to better quantify these emissions without a model?
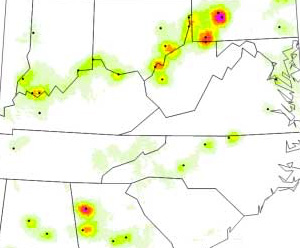
OMI data confirm a substantial reduction in sulfur dioxide (SO2 ) values around the largest US coal power plants as a result of the implementation of pollution control measures.
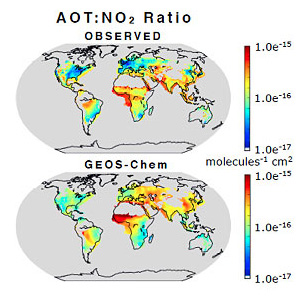
Information on the global composition of aerosol particles, their emission sources and relative regional pollution controls of combustion processes.
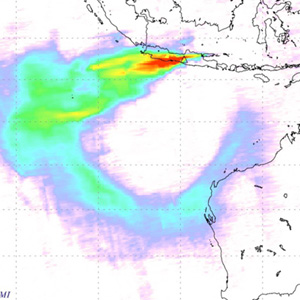
Indonesia's Mount Merapi turned destructive, unleashing a series of eruptions.
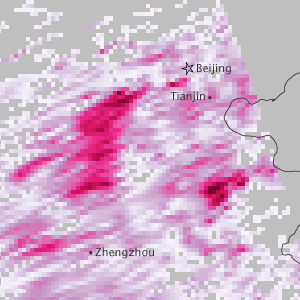
Aura observes a high-pressure weather system settled in over eastern China, in which air pollution began to accumulate locally for nearly a week.
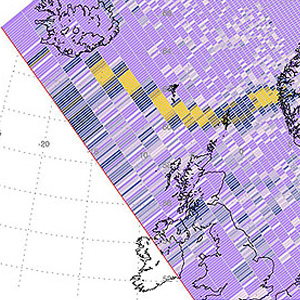
Near-real-time OMI images of ash and sulfur dioxide from Icelandic eruption.
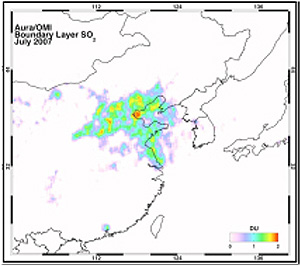
Chinese sulfur dioxide (SO2) emission controls were given a major strengthening in the 11th Five-Year-Plan.
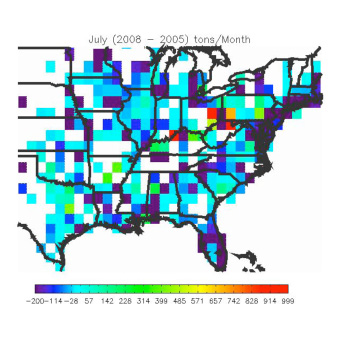
Regulations have resulted in reduced NOx emissions from major point sources over much of the Eastern US as shown by OMI's Continuous Emission Monitoring System data.
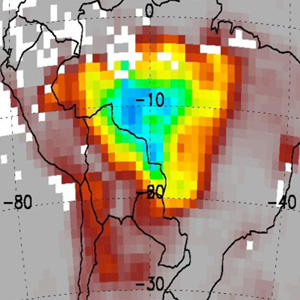
OMI observes large decrease of South American biomass burning in 2008.
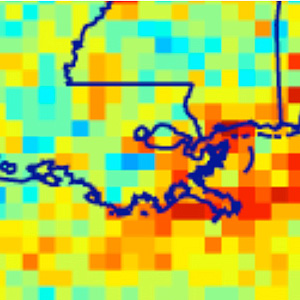
Hurricanes Katrina and Rita caused a significant reduction in nitrogen dioxide emissions.
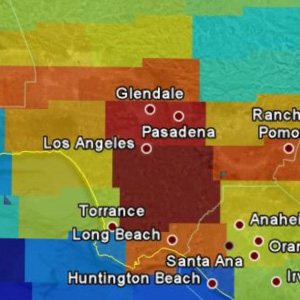
Aggressive air quality regulations of emission reductions show results in Aura's OMI imagery.
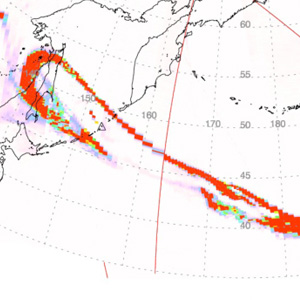
The eruption of Sarychev Peak (Kurile Islands) in mid-June 2009 produced a large stratospheric sulfur dioxide cloud that spread rapidly eastward in strong jet stream winds.
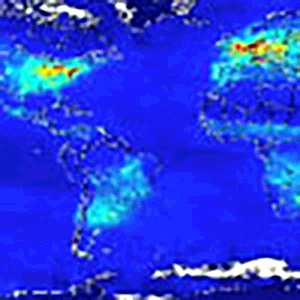
View collection of movies created from Aura's OMI instrument of NO2 in the troposphere.
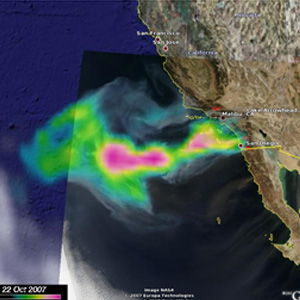
NASA satellites continue to capture remarkable new images of the wildfires raging in Southern California. Aura's OMI images show the smoke aerosol layer generated by the fires in Southern California as it drifts over the Pacific Ocean.
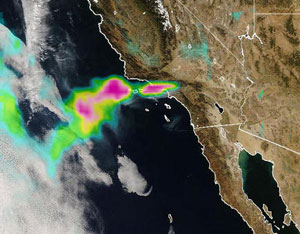 California fires as seen from MODIS and OMI
Smoke from the recent outbreak of fires in Southern California can clearly be seen via NASA satellites.
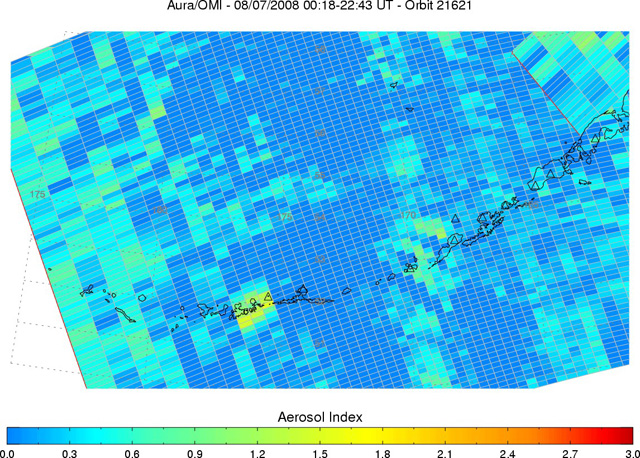 Aleutians Eruption
OMI captured the SO2 cloud in 2 consecutive orbits of the eruption in the Aleutians.
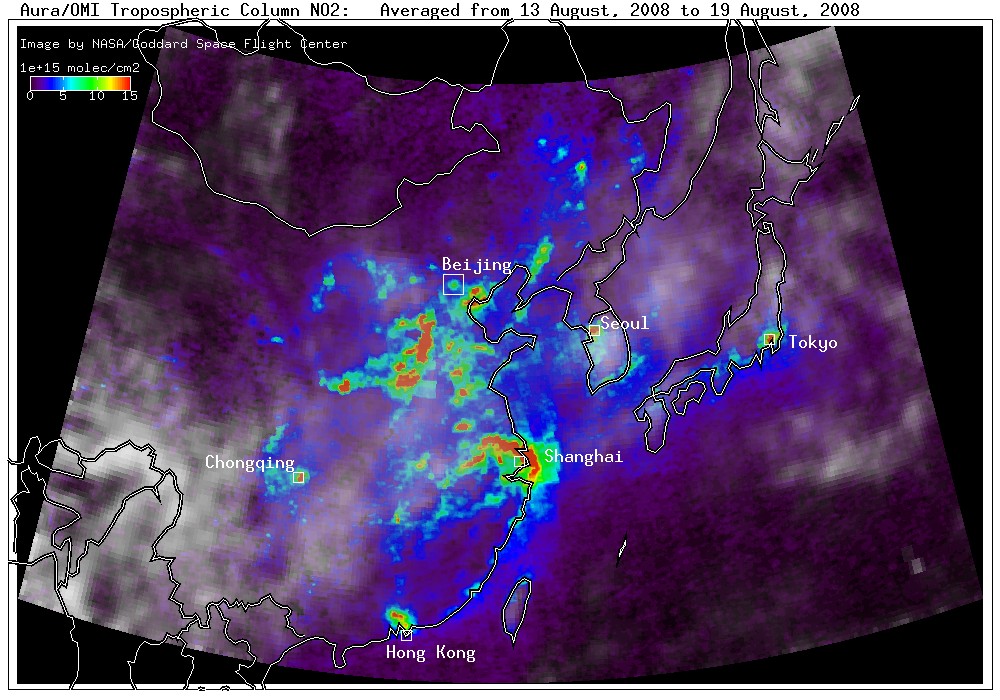 Air Quality during the Olympics
Restrictions were put on traffic and power plants to improve air quality in Beijing during the Olympics. OMI makes daily measurements of the total column of SO2 and NO2.
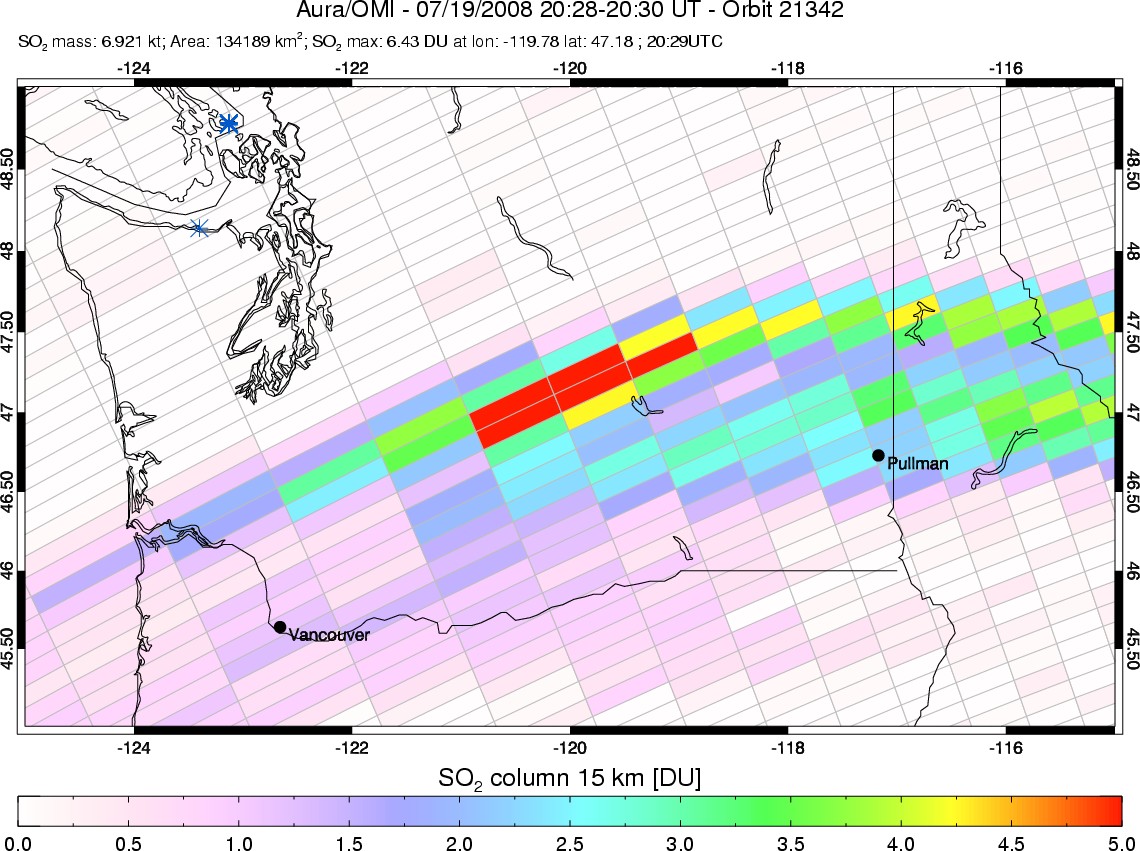 Okmok eruption
Sulfur dioxide measurements from the Ozone Monitoring Instrument (OMI) on Aura permitted tracking of the eruption cloud in near real-time.
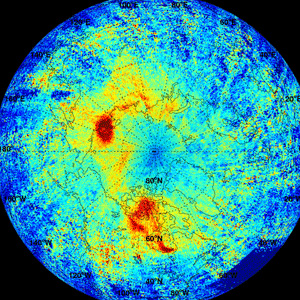
Despite its low atmospheric abundance, bromine monoxide (BrO) plays an important role in the chemistry of the atmosphere because it is a catalyst of the ozone destruction.
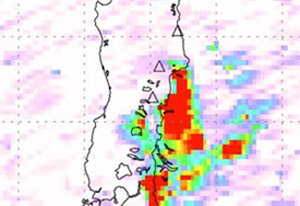
The Chaiten volcano eruption in southern Chile caught local authorities by surprise as experts say it has been dormant for at least 450 years.
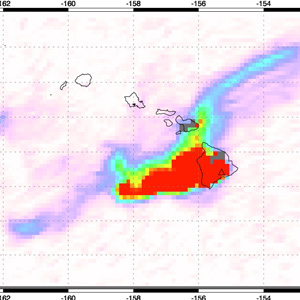 Sulfur Dioxide and Vog from Kilauea
 In late April 2008, Kilauea Volcano Volcano on Hawaii's big island continued its pattern of increased activity, including elevated seismic tremors.
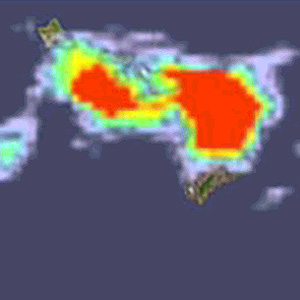 Sulfur Dioxide over Hawaii
Aura's OMI instrument provided the imagery used in the animation of the Sulfur dioxide (SO2) emissions over Hawaii. The volcano, which has been erupting since 1983, began venting elevated levels of sulfur dioxide from Halemaumau Crater, located atop the volcano, in mid-March.
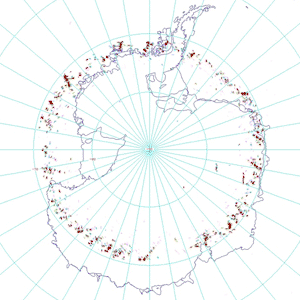 Llaima Volcano Eruption
The Llaima Volcano is one of Chile's most active volcanoes and has frequent but moderate eruptions. An eruption on January 1, 2008 forced the evacuation of hundreds of people from nearby villages.
 Fires In Southern California
NASA satellites continue to capture remarkable new images of the wildfires raging in Southern California. Aura's OMI images show the smoke aerosol layer generated by the fires in Southern California as it drifts over the Pacific Ocean.
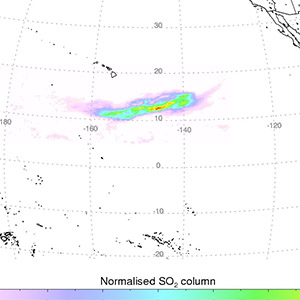 OMI Measures Volcanic Gas Cloud
On May 20, 2006 a major lava dome collapse at the Soufriere Hills volcano triggered an explosive emission of volcanic gases. Sulfur dioxide in the resulting gas cloud was tracked by OMI for 3 weeks as it moved westwards across the Pacific.
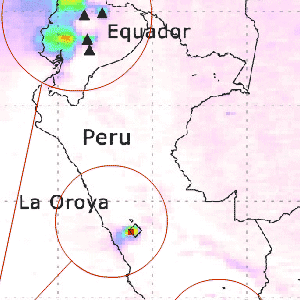 SO2 Emissions from Smelters
 The Peruvian copper smelters are among the world's largest industrial point sources of sulfur dioxide (SO2), and are among the most polluting in the world. OMI is sensitive enough to identify copper being emitted from the La Oroya and Ilo smelters even though these produce less SO2 than the volcanoes.
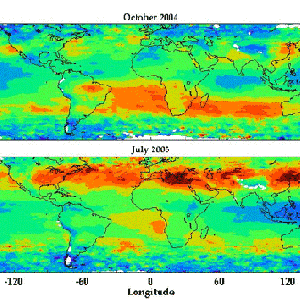 First global tropospheric maps show streams of tropospheric ozone crossing the oceans
OMI & MLS can estimate the tropospheric ozone residual by subtracting the MLS stratospheric ozone from OMI column ozone. These maps show pollution streaming from the U.S., Europe and China to the west in summer and pollution from biomass burning in the equatorial zone.
 Asian Dust Storms
Asia is suffering through the worst dust storm season in at least five years. The eighth major storm this year clogged the air over China, Korea, and Japan with sand from the Taklamkan and Gobi deserts. The sand picks up a toxic mix of heavy metals and carcinogens as the clouds pass over China's industrial areas, exacerbating health problems due to these storms.
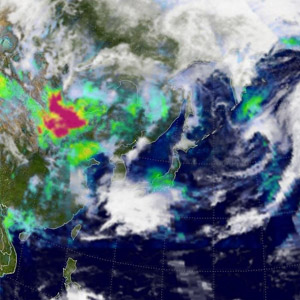 South Korea gets rare yellow snowfall
South Koreans were treated to a rare weather phenomenon on Monday when yellow snow fell in the capital and elsewhere across the country.
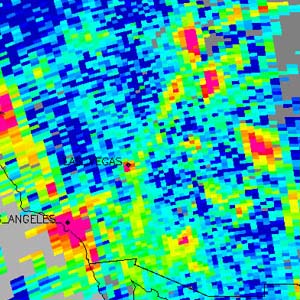 NASA Satellite Eyes Atmosphere to Improve Pollution and Climate Forecasting
Thanks to the latest sophisticated, satellite-based instruments, local and regional air pollution and their sources can now be observed closely from space.
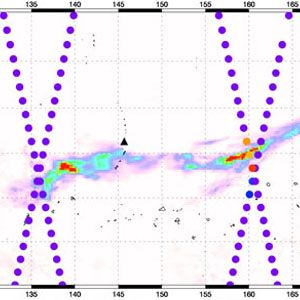 Eruption of Anatahan
This image of the volcanic eruptions from Anatahan (Mariana Islands) shows sulfur dioxide concentrations in the atmosphere on April 7, 2005, over 30 hours after the eruption.
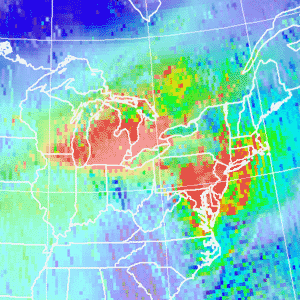 OMI Measurement of Nitrogen Dioxide
This image from Aura's OMI instrument shows the total column amount of nitrogen dioxide, a precursor to the formation of tropospheric ozone.
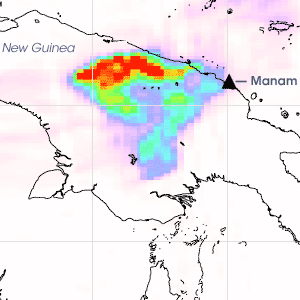 Sulfur Dioxide Plume From Manam Volcano
When the Manam volcano erupted explosively in the middle of the night on January 27, 2005, it sent a cloud of ash and sulfur dioxide over New Guinea.
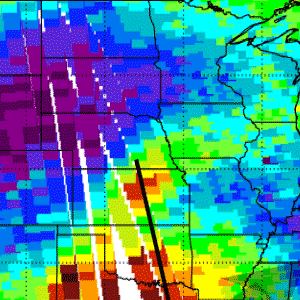 Tropospause Fold
View this OMI vs TOMS data imagery of the United States