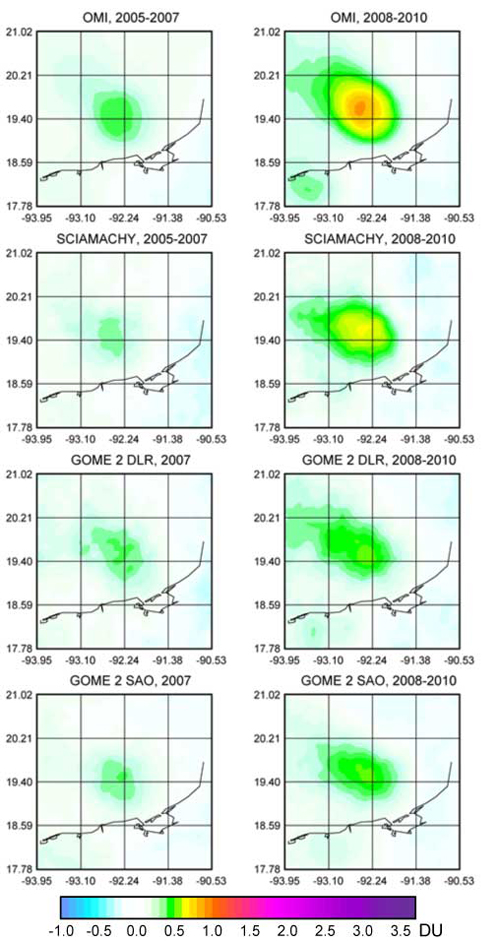
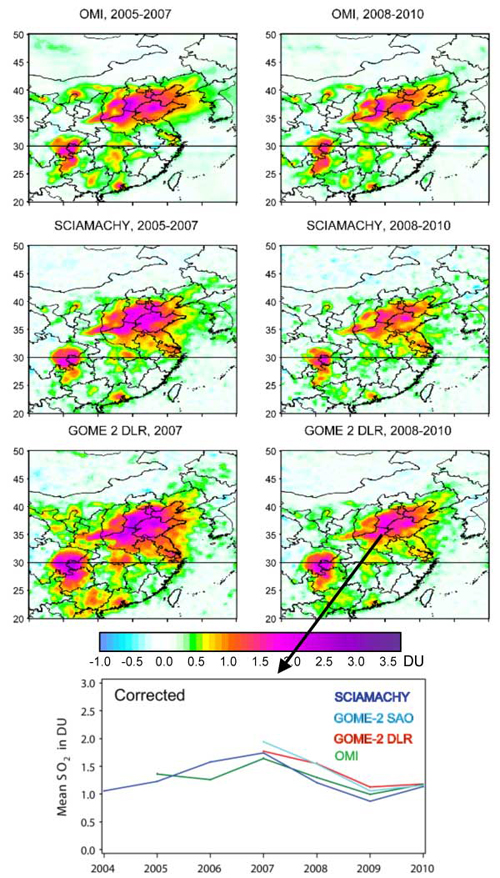
Standard SO2 data products demonstrate large biases that vary from region to region and satellite to satellite. These biases are due to the influence of ozone variations on SO2 retrievals and changes in instrument characteristics. Pixel averaging and spatial filtration procedures are shown to remove instrument biases, producing consistent data from the three satellites instruments. All three detect about 30 natural and anthropogenic continuously-emitting, localized sources and SO2 emissions were estimated from each.
China has a very large number of individual SO2 sources. Although standard SO2 data products from the three satellites differ by more than 50%, the spatial filtration technique largely reconciles these differences (right). The SO2 time series over northern China indicate a large increase until 2007, likely due to the construction of numerous coal-fired power plants in the region. The reversal in the trend in 2008-2009 was probably caused by both pollution control and the slow-down in the global economy. The growing trend has resumed since 2009, as the economy recovers from the recession.

(Above) Mean SO2 distribution over Cantarell and Ku-Maloob-Zaap Oil Fields, Gulf of Mexico, for 2005-2007 and 2008-2010. SO2 values in Dobson Units (DU) are shown, 1 DU = 2.69 . 1016 molecules cm-2. OMI SO2 values (top) are highest because of the finest ground resolution (13km x 24km)

(Above) Average SO2 (DU) over major industrial regions of China from OMI, SCIAMACHY, and GOME-2 (DLR and SAO) in 2005-2007 and 2008-2010 and (bottom) the mean SO2 values over an area (34N-38N, 112E-118E) . All data sources demonstrate a similar evolution of SO2 over China.
Fioletov, V., et al., (2013), Journal of Geophysical Research-Atmospheres, in press; "AGU Research Spotlight."
10.23.2013