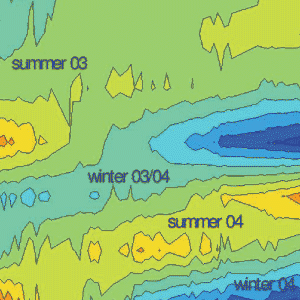
Time-pressure sections of zonally averaged water vapor mixing ratio, shown as the deviation from the time-mean profile.
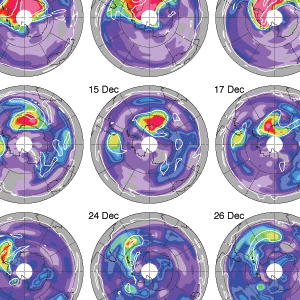
Maps of MLS HCI in the lower stratosphere (520 K, 20km) detailing the springtime breakup of the 2004 Antarctic vortex.
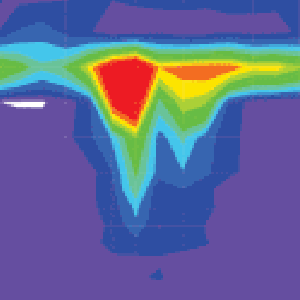
Aura MLS has provided first observation of this connection
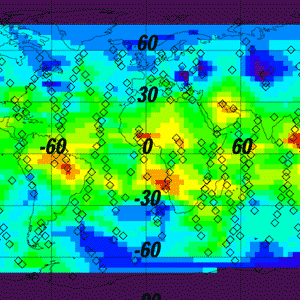
HDO measurements tell us about ice cloud formation and evaporation. This is the first map of HDO ever made.
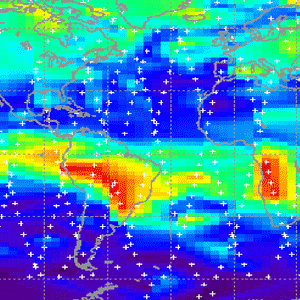
High values of CO near biomass burning regions and NH cities. CO in the upper trop is lofted by convection and fires.
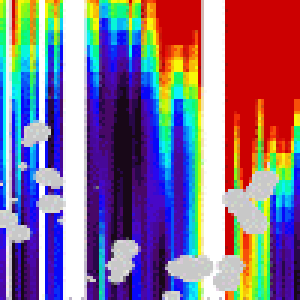
The AIRS-visible images (left) show the TES footprint locations (blue) over a variety of cloud and surface conditions.