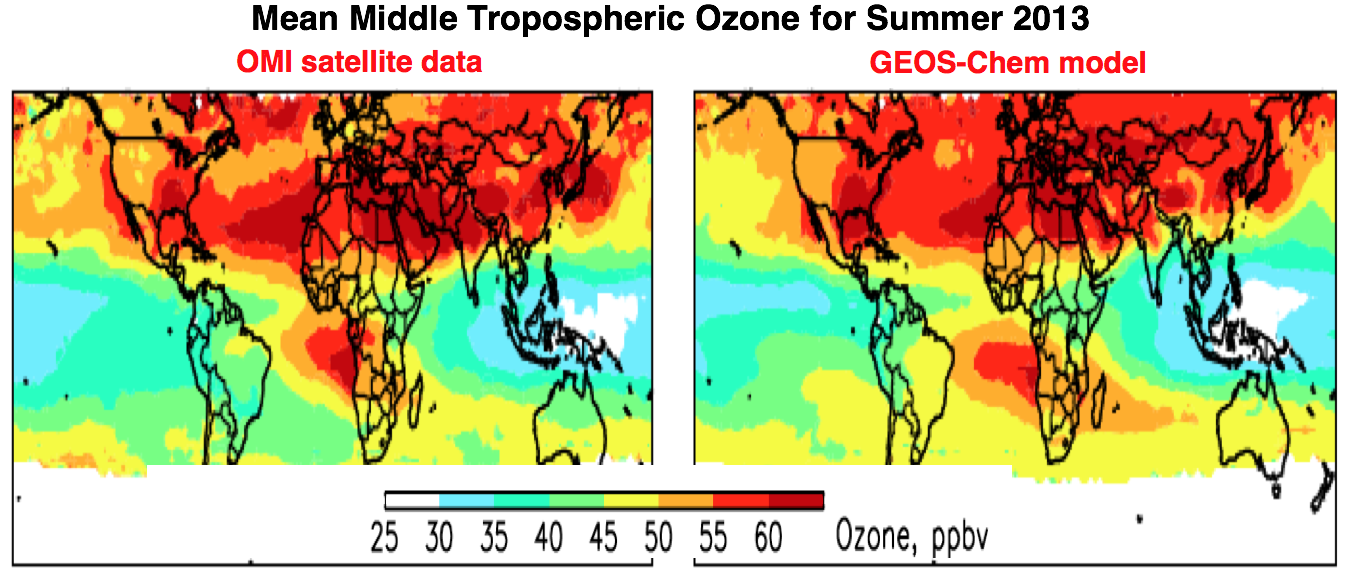
Mean middle tropospheric ozone as a June-August 2013 average for (left) OMI data from Xiong Liu (Harvard Smithsonian Astrophysical Observatory, SAO) and (right) the GEOS-Chem atmospheric chemistry transport model (CTM) output.
Scientific significance, societal relevance, and relationships to future missions:
The global budget of tropospheric ozone is governed by a complicated ensemble of coupled chemical and dynamical processes. Simulation of tropospheric ozone has been a major focus of the GEOS-Chem chemical transport model (CTM) over the past 20 years, and many developments over the years have affected the model representation of the ozone budget. Here we conduct a comprehensive evaluation of the standard version of GEOS-Chem (v10-01) with ozone observations from ozonesondes, the OMI satellite instrument, and MOZAIC-IAGOS commercial aircraft for 2012-2013. Global validation of the OMI 700-400 hPa data with ozonesondes shows that OMI maintained persistent high quality and no significant drift over the 2006-2013 period. GEOS-Chem shows no significant seasonal or latitudinal bias relative to OMI and strong correlations in all seasons on the 2x2.5 degree horizontal scale (r = 0.88-0.95), improving on previous model versions. The most pronounced model bias revealed by ozonesondes and MOZAIC-IAGOS is at high northern latitudes in winter-spring where the model is 10-20 ppbv too low. This appears to be due to insufficient stratosphere-troposphere exchange (STE). Model updates to lightning x, Asian anthropogenic emissions, bromine chemistry, isoprene chemistry, and meteorological fields over the past decade have overall led to gradual increase in the simulated global tropospheric ozone burden and more active ozone production and loss. From simulations with different versions of GEOS meteorological fields we find that tropospheric ozone in GEOS-Chem v10-01 has a global production rate of 4960- 5530 Tg/a, lifetime of 20.9-24.2 days, burden of 345-357 Tg, and STE of 325-492 Tg/a. Change in the intensity of tropical deep convection between these different meteorological fields is a major factor driving differences in the ozone budget.
Data Sources: Zhang et al. (2010) demonstrated general consistency of the OMI tropospheric ozone data for 2006 with concurrent data from the Aura TES thermal IR instrument and with ozonesondes. The OMI bias relative to ozonesondes was 2.8±6.6 ppbv and differences with TES were generally < 10 ppbv. Starting in 2009 OMI began to experience a "row anomaly" error (partial blockage of the field of view). Here we examine the im-plications for the OMI tropospheric ozone retrieval by comparing the 2011-2013 and 2008 OMI data at 700-400 hPa to collocated sonde data. We apply the OMI averaging kernel smoothing to the ozonesonde data following Zhang et al. (2010), and require coincident measurements within 1.25 degree longitude, 1 degree latitude, and 10 h. This results in 1311 coincidences for 2011-2013 and 889 for 2008. Statistics show that OMI ozone data quality degraded only slightly over the 2006-2013 period. The global mean bias relative to the sondes is 3.6±8.5 ppbv for 2011-2013, as compared to 2.7±6.6 ppbv for 2008 and 2.8±6.6 ppbv for 2006 reported by Zhang et al. (2010). The bias is similar at northern mid-latitudes and in the tropics, and lower at southern mid-latitudes. The results here are generally consistent with independent OMI validation against ozonesondes. The larger standard deviation in 2011-2013 is due to the increase of retrieval noise and the impacts of OMI row anomaly. Seasonal scatterplots of coincident OMI and ozonesonde measurements at 700-400 hPa for 2011-2013. The OMI ozone biases are consistent across sites and have little seasonal variation. Thus the OMI data can be corrected for a mean global bias (3.6 ppbv) and then used for model evaluation to provide full spatial coverage. An exception is for high northern latitudes (>45 degrees N) in winter-spring where OMI has large biases. We exclude these data from further analysis.
References: Hu, L., D.J. Jacob, et al., Global budget of tropospheric ozone: evaluating recent model advances with satellite (OMI), aircraft (IAGOS), and ozonesonde observations, Atmos. Environ., 167, 323-334, 2017.
11.16.2017