Sulfate commonly makes up >10% of the fine particles in China and India, often much more during heavy pollution episodes. To predict and mitigate air pollution, air quality models require accurate information on the emissions of SO2 and other pollutants. In the conventional approach, one compiles bottom-up emission inventories based on activity rates and emission factors. These inventories are normally updated every 3-5 years and often have to be projected for very recent years. Substantial uncertainties can therefore exist in the estimated or projected emissions, especially for regions experiencing rapid changes in economy and environmental regulations such as China and India.

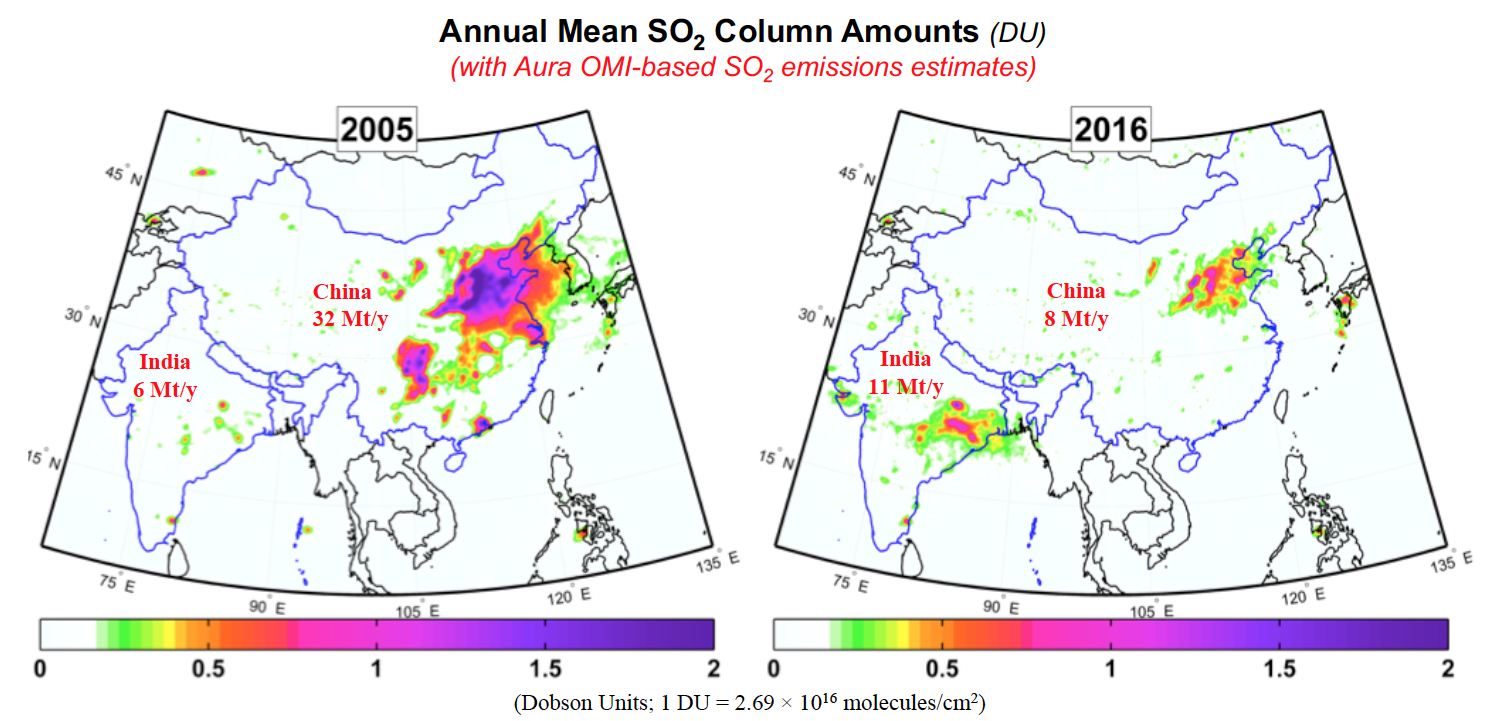
Annual mean SO2 column amounts over Asia in Dobson Units (1 DU = 2.69 x 10¹⁶ molecules/cm2 ) for 2005 (left) and 2016 (right) retrieved by Aura Ozone Monitoring Instrument (OMI). The total column amount or vertical column density reflects the estimated total number of SO2 molecules in the entire atmospheric column above a unit area of the surface. The retrieved column amounts change with the assumed a priori vertical profiles of SO2 . In this plot, SO2 is presumed to be released from anthropogenic sources and predominantly in the planetary boundary layer or the lowest ~1 km of the atmosphere. For this analysis, OMI pixels with a large cloud fraction (> 0.2) or a large solar zenith angle (> 70° ) or from the edge of the swath (cross track positions 1-10 and 51-60) were excluded. Additionally, data from days potentially influenced by large transient volcanic plumes were excluded.
Scientific significance, societal relevance, and relationships to future missions:
Severe haze has become an important public health issue in India and China, causing an estimated >1 million premature deaths/y. Both countries rely heavily on sulfur-rich coal as an energy source to fuel their fast growing economies. The resulting emissions of SO2 , a toxic pollutant gas, lead to production of sulfate aerosols that reduce visibility and adversely affect human health. Accurate information on the sources of SO2 and other pollutants is needed for predicting and mitigating air pollution.
For India and China, such information has been difficult to obtain, due to incomplete or outdated knowledge on emission sources. Here, we demonstrate that OMI data can provide "top-down" constraints on SO2 emissions. We show that China and India are on opposite trajectories in terms of SO2 pollution. Since 2007, SO2 emissions in China have declined by 75% due to effective pollution control. Meanwhile, SO2 emissions in India have increased by 50% due to continued lack of control. As a result, India is now becoming the world's top emitter of anthropogenic SO2 .
Our finding is largely unexpected in recent bottom-up projections. While most predict the decrease of SO2 emissions from China, OMI data suggest that the reduction has occurred much sooner and faster than expected. Despite this reduction, haze is still a severe problem in China, suggesting that it is also critical to reduce the emissions of other pollutants, such as NO2 and VOCs. We estimate that ~33 million people in India now live in areas with severe SO2 pollution, and this number will grow further due to continued growth in coal consumption.
Finally, the loading of sulfate aerosols over East Asia will likely decrease as a result of SO2 reduction, and this may lead to accelerated regional warming. Our results highlight the value of long-term, consistent satellite observations in detecting changes in global and regional environment. It has been demonstrated that the PCA algorithm is capable of producing highly consistent SO2 data between Aura/OMI and SNPP/OMPS. The algorithm can also be implemented with NASA/NOAA JPSS-1/OMPS and ESA TROPOMI, as well as future geostationary sensors such as NASA/TEMPO and Korean GEMS.
Data Sources: Our cloud-ozone data product is generated by combining profile ozone from the Aura Microwave Limb Sounder (MLS) with both column ozone and cloud parameter measurements from the Aura Ozone Monitoring Instrument (OMI). These "cloud-ozone" measurements represent the mean ozone concentration (in units ppbv) of ozone lying in the upper levels of deep convective clouds between 550 hPa and cloud top. The time period covered for this first version of the cloud-ozone data is October 2004 through April 2016 with spatial coverage from 30°S to 30°N. This cloud-ozone data product is the first of its kind and is made available and free for the public via ftp://jwocky.gsfc.nasa.gov/. We acknowledge greatly the Aura MLS and OMI instrument and algorithm teams for their extensive satellite data included in our study. OMI is a Dutch-Finnish contribution to the Aura mission.
Level 2 NASA Aura Ozone Monitoring Instrument (OMI) total column SO2 data (OMSO2) produced from OMI level 1 radiance data, using the NASA GSFC principal component analysis (PCA) satellite trace gas retrieval algorithm. A database of annual SO2 emissions for ~500 large point sources worldwide, including 47 in India and 82 in China, estimated by combining OMSO2 product and assimilated wind field: Vitali Fioletov, Chris McLinden, Nickolay Krotkov, Can Li, Peter Leonard, Joanna Joiner, Simon Carn (2017), Multi-Satellite Air Quality Sulfur Dioxide (SO2) Database Long-Term L4 Global V1, Greenbelt, MD, USA, Goddard Earth Science Data and Information Services Center (GES DISC), doi:10.5067/MEASURES/SO2/DATA403
References: 1) Li, C., McLinden, C., Fioletov, V., Krotkov, N., Carn, S., Joiner, J., Streets, D., He, H., Ren, X., Li, Z., and Dickerson, R.: India is overtaking China as the world's largest emitter of anthropogenic sulfur dioxide, Scientific Reports , DOI:10.1038/s41598-017-14639-8 , 2017. 2) Fioletov, V. E., McLinden, C. A., Krotkov, N., Li, C., Joiner, J., Theys, N., Carn, S., and Moran, M. D.: A global catalogue of large SO2 sources and emissions derived from the Ozone Monitoring Instrument. Atmos. Chem. Phys. 16, 11497-11519, 2016.
11.16.2017