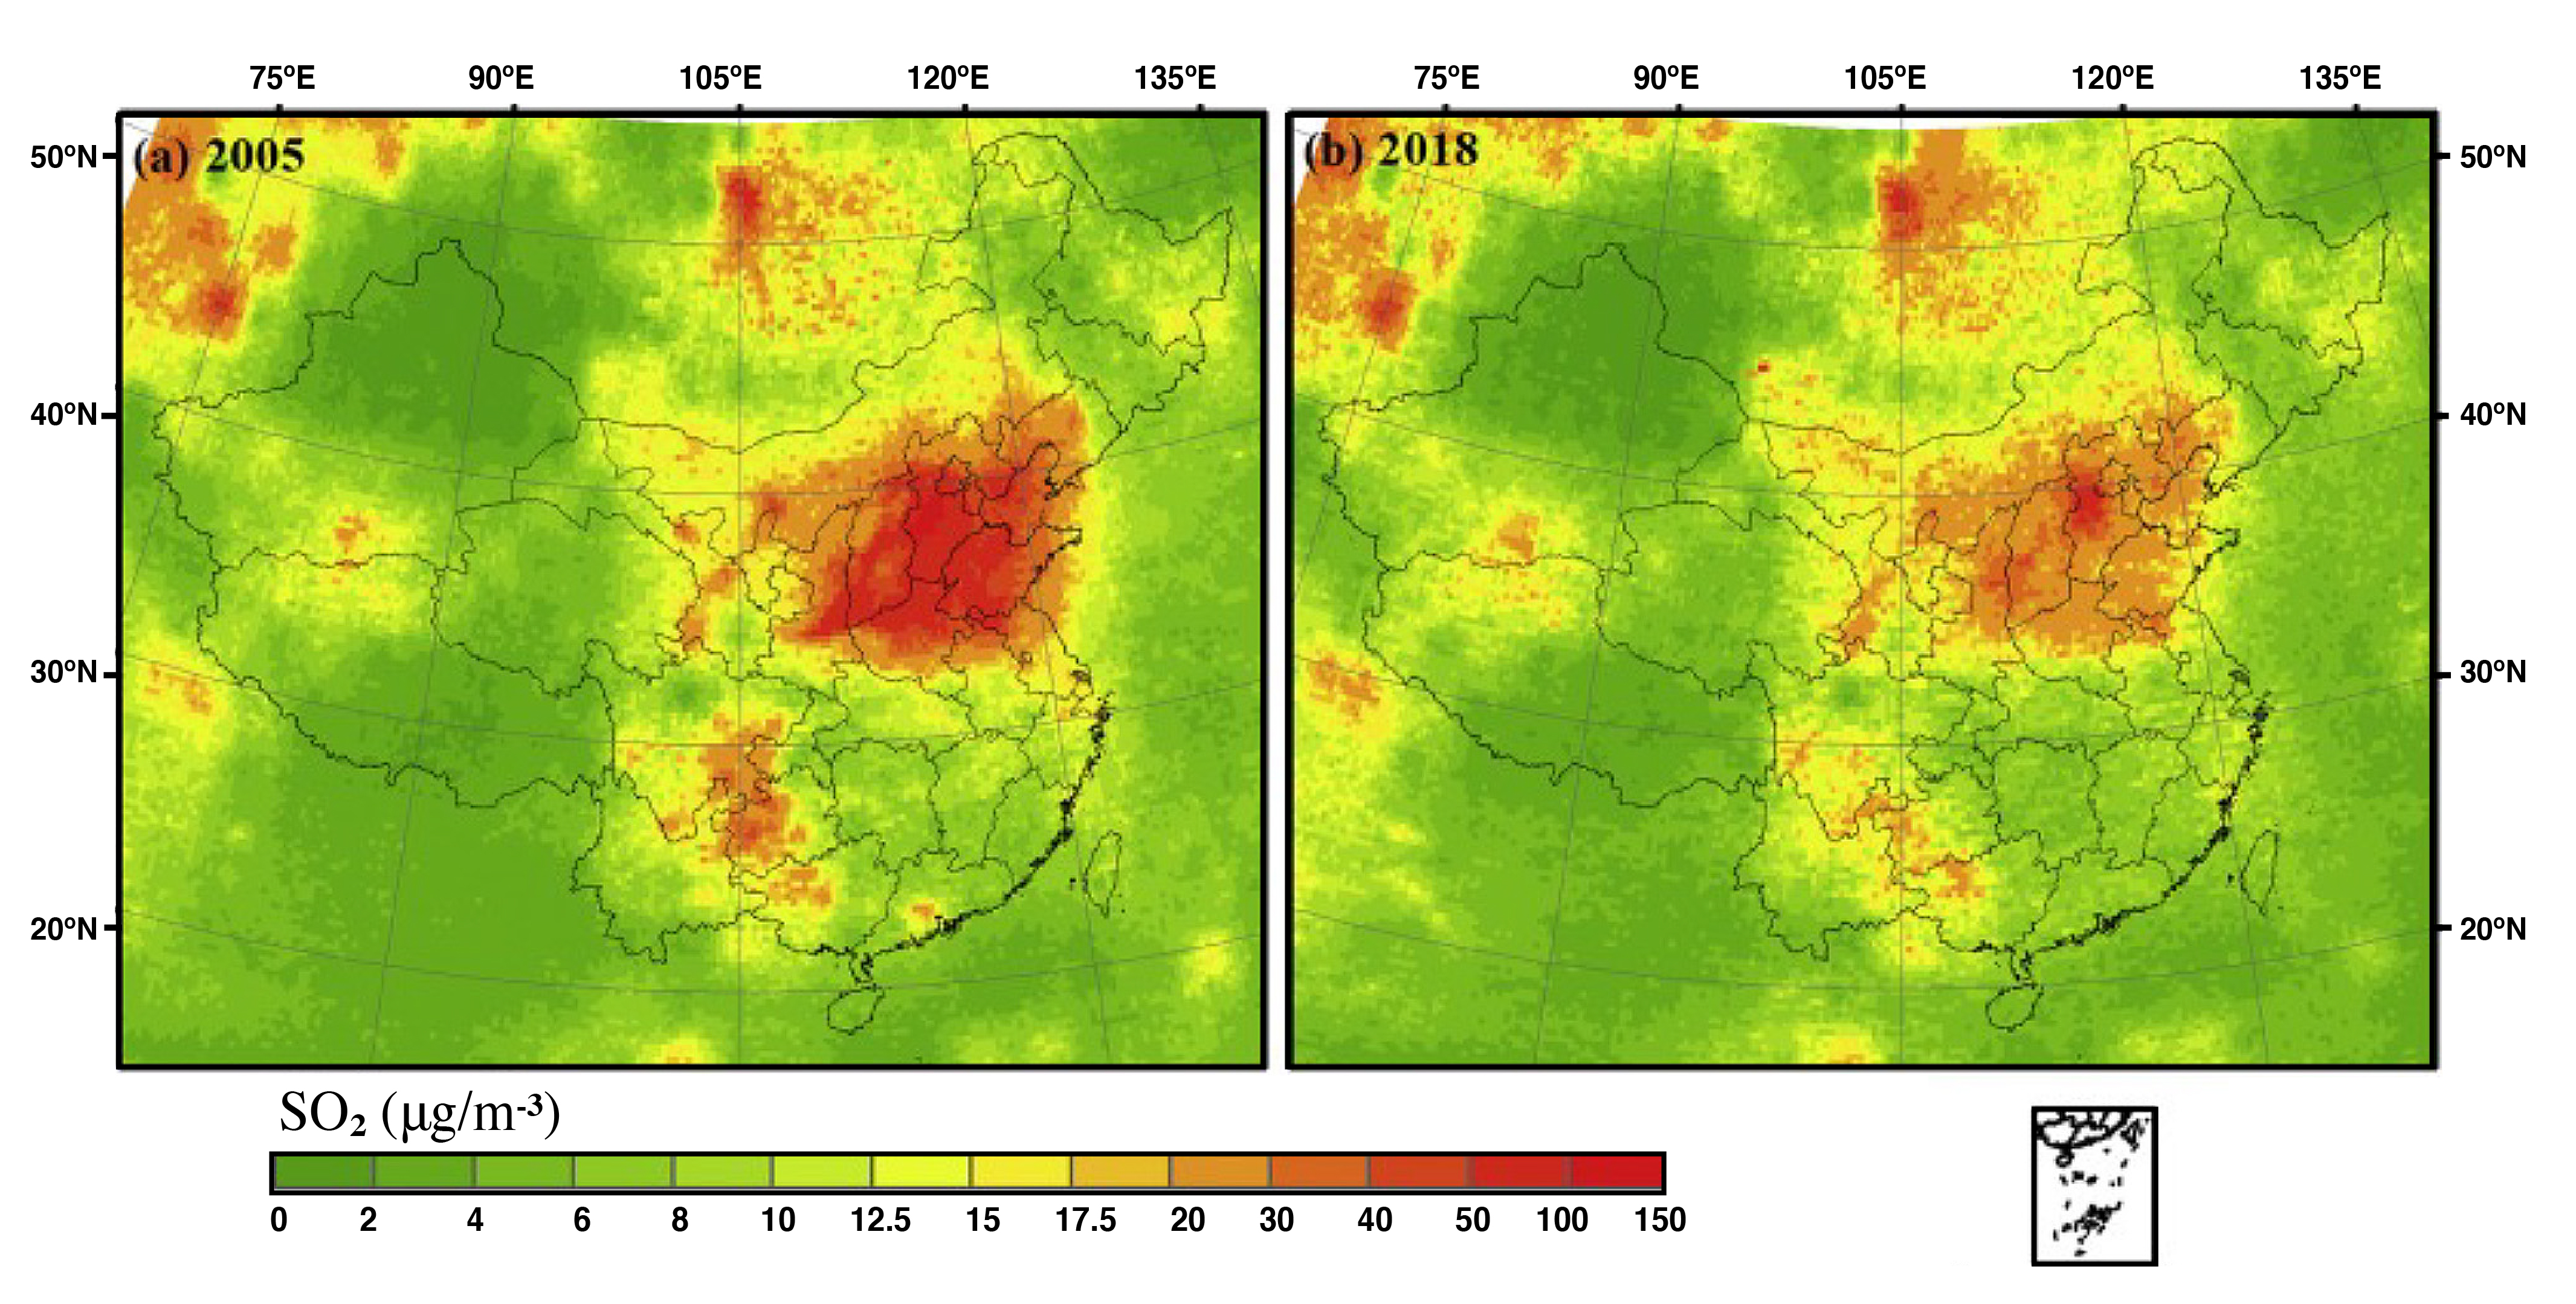
 Figure 1: Spatial distribution of the OMI-derived ground-level SO2 concentration in (a) 2005, and (b) 2018 across China.
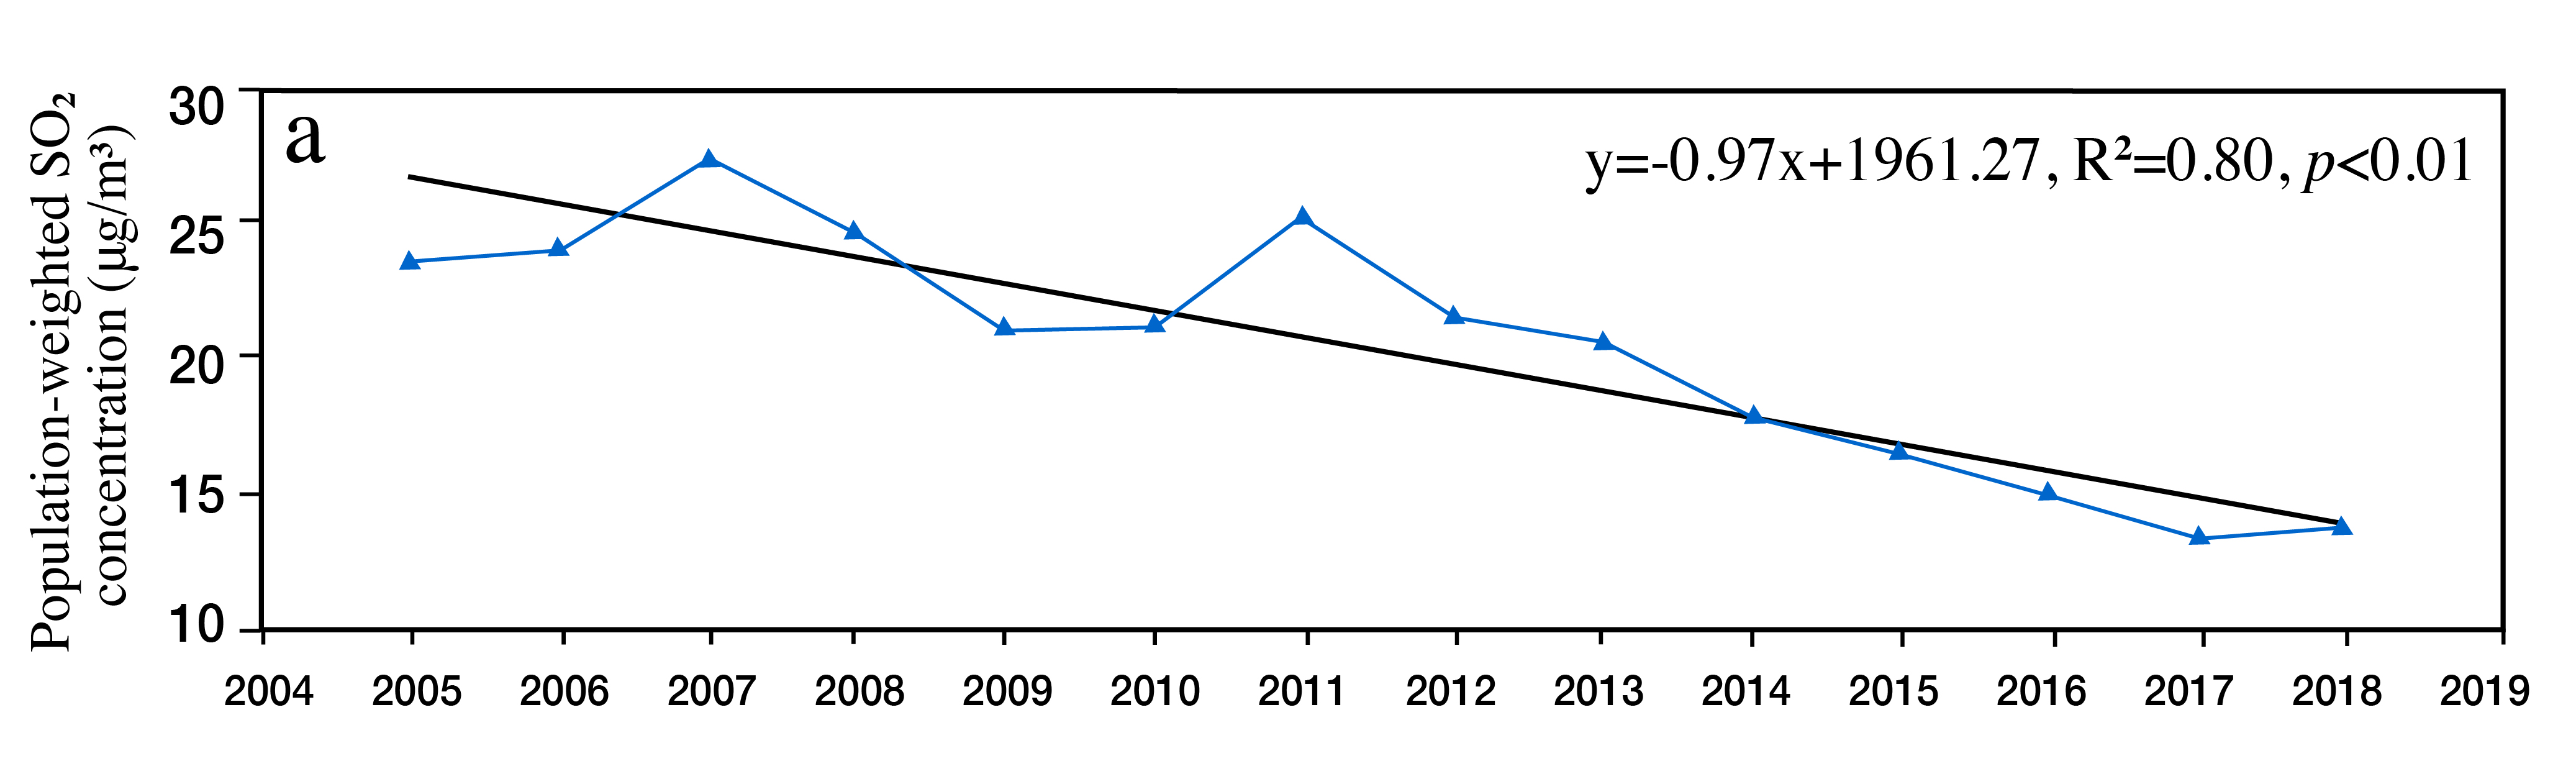 Figure 2: Long-term trends in the annual population-weighted SO2 concentration across China from 2005 to 2018.
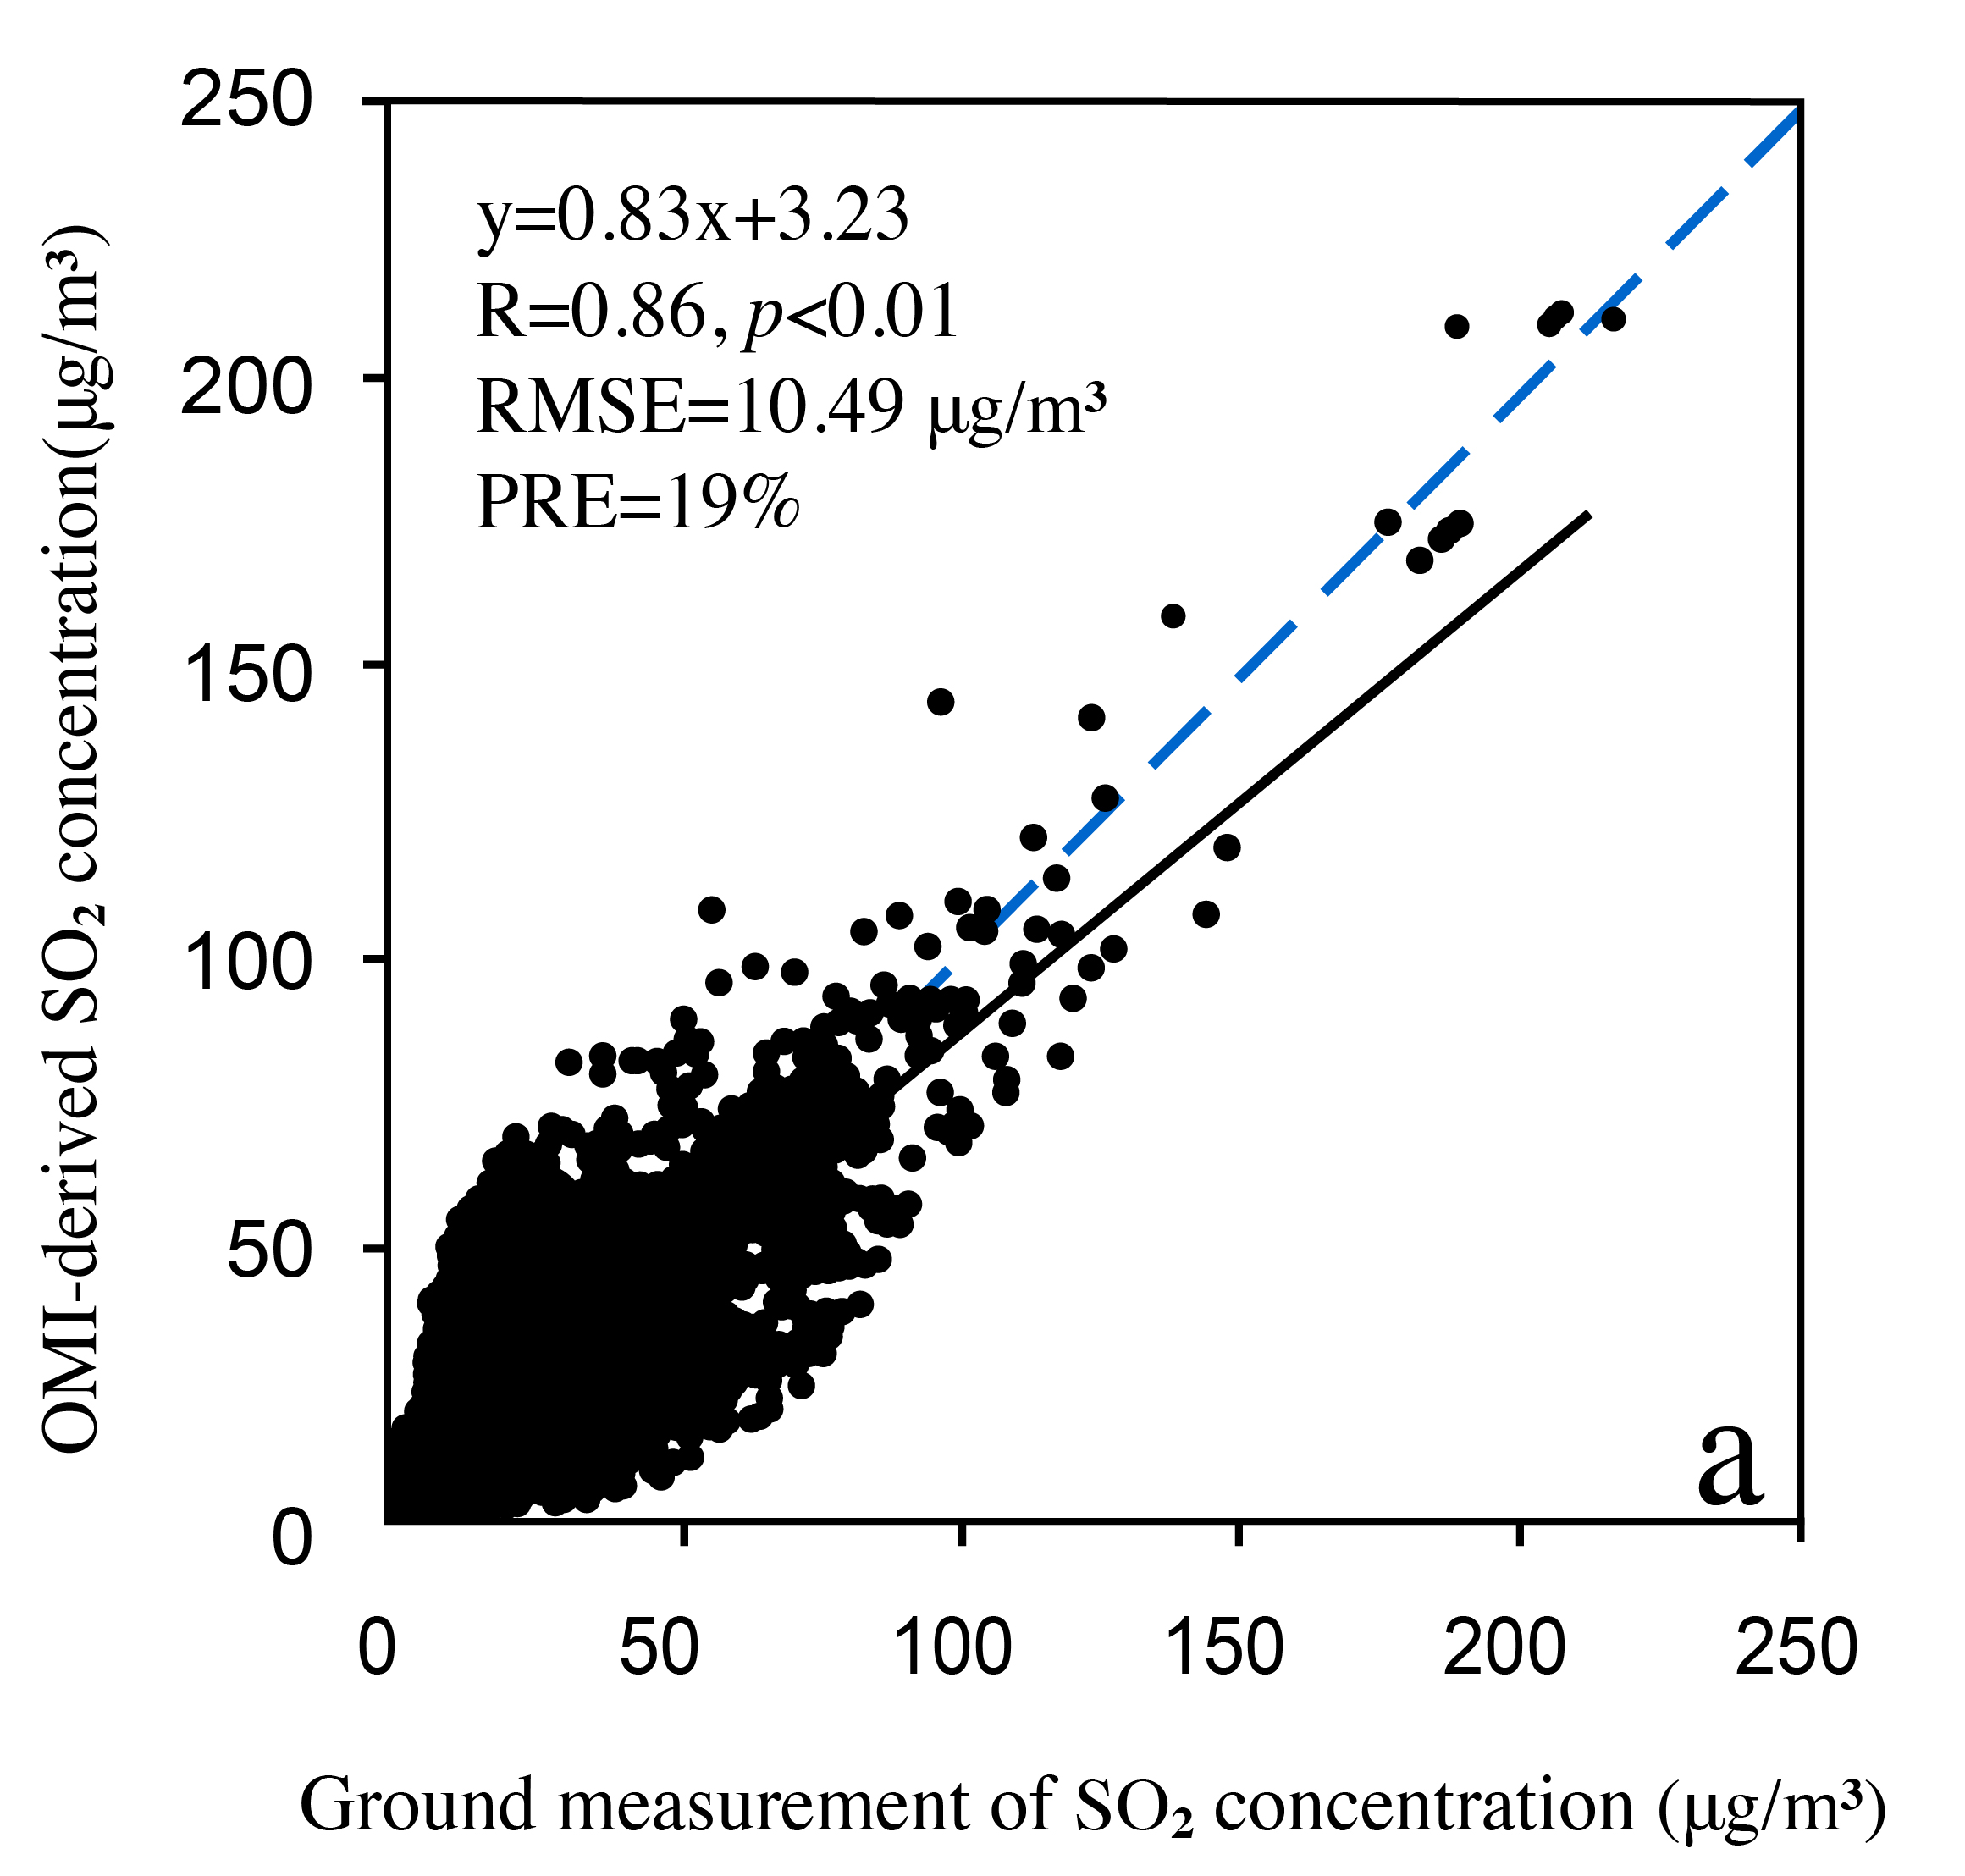 Figure 3: Precision assessment of the OMI-derived SO2 concentrations using the ground measurements: a, scatterplot between the OMI-derived SO2 concentrations and the ground observations at the pixel scale of 0.25° × 0.25°.
Technical Description of Figures:
Figure 1: Spatial distribution of the OMI-derived ground-level SO2 concentration in (a) 2005, and (b) 2018 across China.
Figure 2: Long-term trends in the annual population-weighted SO2 concentration across China from 2005 to 2018.
Figure 3: Precision assessment of the OMI-derived SO2 concentrations using the ground measurements: a, scatterplot between the OMI-derived SO2 concentrations and the ground observations at the pixel scale of 0.25° × 0.25°.
Scientific significance, societal relevance, and relationships to future missions:
In late December 2019/early January 2020, during the devastating Black Summer fire season in Australia, an intense outbreak of a number of fire-induced and smoke-infused thunderstorms (termed pyrocumulonimbus, pyroCbs) occurred, collectively known as the Australian New Year’s (ANY) event. MLS and ACE–FTS provide unique measurements of the primary components of the stratospheric chlorine budget, along with transport tracers.
In the months following ANY, well after distinct plumes of fire-influenced air dispersed, these data show unprecedented prolonged and pervasive depletion in HCl (50%–60% below climatology) and enhancements in both ClO and ClONO2 in the SH midlatitude lower stratosphere that were not transport related, with peak anomalies occurring in mid-2020.
We conclude that the observed perturbations likely arose from heterogeneous chlorine activation on widespread aged smoke particles. Although such sustained enhancement in reactive chlorine had never before been observed in the midlatitudes, it was still an order of magnitude or more weaker than that in a typical stratospheric winter polar vortex and induced at most minor changes in ozone. Detailed investigation, including chemical modeling, will be needed to identify the specific characteristics of the ANY smoke particles that facilitated such dramatic midlatitude chlorine repartitioning.
Deeper understanding of the processes involved is critical to assessing the likelihood of significant changes in midlatitude composition in a future climate in which the stratosphere is expected to be colder, wetter, and more frequently affected by pyroCb events. No confirmed plans for future spaceborne measurements of stratospheric HCl, ClO, or ClONO2 (by NASA or other agencies) currently exist.
Data Availability:
OMI is a nadir-oriented, UV–visible spectrometer on the Aura satellite, and it has a local equatorial overpass time of 13:40 on the ascending node (Levelt et al., 2006). The OMI daily L3e (Level 3e) SO2 column is retrieved based on principal component analysis (Read More), with a spatial resolution of 0.25° × 0.25° in Dobson units (DU) (Li et al., 2013). Each grid cell in the L3e product was selected from the level 2 observations based on 13 exclusion criteria, including the observation time, local calendar dates before/after the L3e day, solar eclipse possibility flag set, row anomaly flag set, a radiative cloud fraction, solar zenith angle, etc. (View PDF).
References:
X. Zhang, Z. Wang, M. Cheng, X. Wu, N. Zhan, J. Xu (2021). Long-term ambient SO2 concentration and its exposure risk across China inferred from OMI observations from 2005 to 2018, Atmospheric Research, 247, https://doi.org/10.1016/j.atmosres.2020.105150.
3.2022

