OBJECTIVES: We aimed to estimate the number of asthma emergency room visits and new onset asthma cases globally attributable to fine particulate matter (PM2.5), ozone, and nitrogen dioxide (NO2) concentrations.
METHODS: We used epidemiological health impact functions combined with data describing population, baseline asthma incidence and prevalence, and pollutant concentrations. We constructed a new dataset of national and regional emergency room visit rates among people with asthma using published survey data. RESULTS: We estimated that 9–23 million and 5–10 million annual asthma emergency room visits globally in 2015 could be attributable to ozone and PM2.5, respectively, representing 8–20% and 4–9% of the annual number of global visits, respectively. The range reflects the application of central risk estimates from different epidemiological meta-analyses. Anthropogenic emissions were responsible for ∼37% and 73% of ozone and PM2.5 impacts, respectively. Remaining impacts were attributable to naturally occurring ozone precursor emissions (e.g., from vegetation, lightning) and PM2.5 (e.g., dust, sea salt), though several of these sources are also influenced by humans. The largest impacts were estimated in China and India.
CONCLUSIONS: These findings estimate the magnitude of the global asthma burden that could be avoided by reducing ambient air pollution. We also identified key uncertainties and data limitations to be addressed to enable refined estimation.
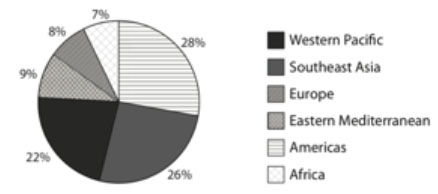
Percent of NO2-attributable new asthma cases among children occurring in each region in 2015.
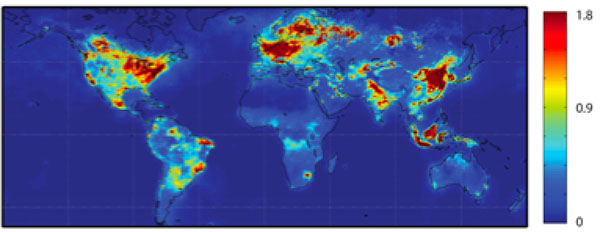
Gridded at 0.1ox0.1o spatial resolution, Ground-level NO2 concentrations in 2015 (annual average, in ppb), using satellite-derived OMI NO2 dataset from method described by Lamsal et al. (2008) and adjusted by modeled ratio of daily average to 1–2 PM concentration.
Scientific significance, societal relevance, and relationships to future missions:
The first estimates of the global asthma burden from ambient air pollution, using OMI-derived surface NO2 estimates, displayed one possible application of satellite datasets for health exposure assessments. Because the dataset was too coarse to resolve near-roadway concentrations, the addition of TROPOMI’s higher spatial resolution data could lead to further advancement of such studies. The upcoming TEMPO mission, with its hourly data, could assist with the uncertainties derived from estimating the diurnal impact of pollutants from once daily satellite datasets. Overall, the satellite NO2data record will be extended with higher spatial and temporal information, increasing the robustness of this type of health exposure assessment of asthma burden and allowing new opportunities for more societal applications of satellite-based data.
Data Sources:
Surface NO2 concentrations for 2015 were developed from satellite observations, following Lamsal et al. (2008). Column NO2 observations from Ozone Monitoring Instrument (OMI) onboard the Aura satellite were gridded to 0.1 × 0.1 degree resolution, and satellite-derived ground-level concentrations were estimated using vertical structure from the GMI-Replay chemical transport model. Concentrations are annual average at the Aura satellite sun-synchronous overpass time of ∼ 1:45 PM local time. These concentrations could underestimate actual exposures because midafternoon concentrations are typically at a low point of the diurnal NO2 concentration cycle, resulting from a combination of fewer emissions between the morning and evening rush hours, high boundary layer heights, and photolysis of NO2 to NO. The satellite- derived exposure estimates were multiplied by the gridded ratio of 24-h average to 1–2 PM NO2 concentrations simulated by the GMI-Replay model at 2 × 2.5 degree resolution for the year 2010. Resulting NO2concentrations used to estimate health impacts are annual average of the 24-h average (“daily weighted”) concentration in each grid cell. Global gridded population of the world was from the Center for International Earth Science Information Network (CIESIN) Gridded Population of the World v4 for the year 2015 data (a NASA Socioeconomic Data and Applications Center [SEDAC] dataset).
References: Anenberg, S. C., D. K. Henze, V. Tinney, P. L. Kinney, W. Raich, N. Fann, C. S. Malley, H. Roman, L. Lamsal, B. Duncan, R. V. Martin, A. van Donkelaar, M. Brauer, R. Doherty, J. E. Jonson, Y. Davila, K. Sudo, and J. C. I. Kuylenstierna (2018). Estimates of the Global Burden of Ambient PM2.5, Ozone, and NO2 on Asthma Incidence and Emergency Room Visits, Environ. Health Perspectives, 126 (10), https://doi.org/10.1289/EHP3766.
10.2018

