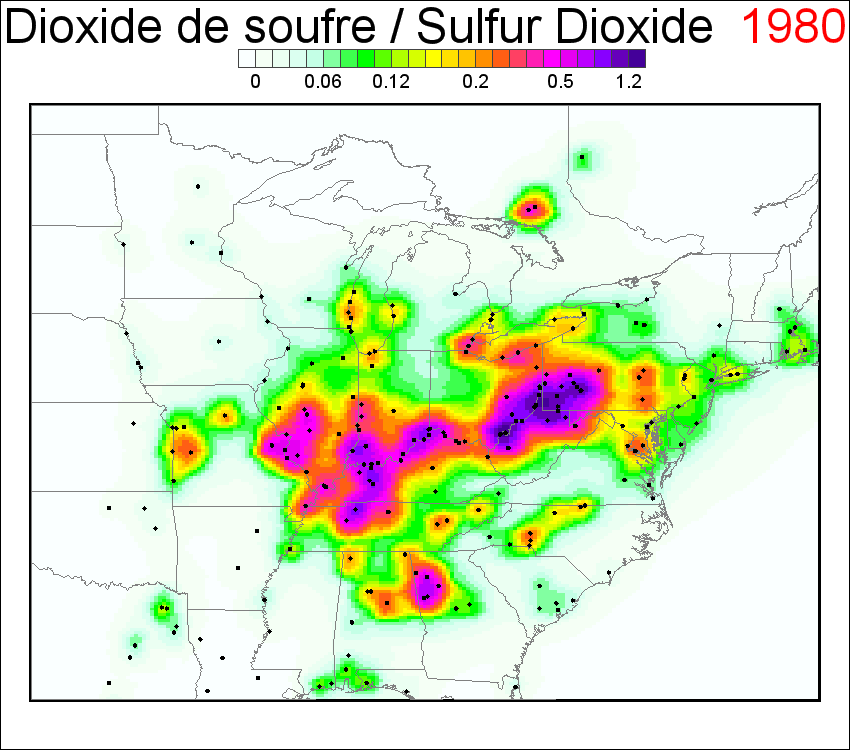
This animated GIF maps (1980 - 2015) show annual mean SO2 VCD (DU) calculated using the plume model applied to the reported bottom-up emission data. Annual emission data from ~380 SO2 sources (black dots) that emitted 1 kt yr -1 at least once in 2005-2015 were included in the calculations.
This study uses satellite measurements of vertical column densities (VCD: the total number of molecules per unit area) of sulfur dioxide (SO2), a criteria air pollutant, to establish a link between reported SO2 emissions, OMI SO2 VCDs measured by satellites, and surface SO2 concentration measurements.
Scientific significance, societal relevance, and relationships to future missions:
This study uses satellite measurements of vertical column densities (VCD: the total number of molecules or total mass per unit area) of sulfur dioxide (SO2), a criteria air pollutant, to establish a link between reported SO2 emissions, OMI SO2 VCDs measured by satellites, and surface SO2 concentration measurements. A high degree of consistency between the reported emissions and measured SO2 values is demonstrated, confirming the success of emission control measures in the US and Canada. Over the past three decades, both the US and Canada have taken measures to reduce SO2 emissions in order to combat acid rain and fine particulate matter. Taking advantage of the consistency between OMI SO2 VCDs and reported emissions, SO2 VCDs were reconstructed from reported emissions data back to 1980.
The results highlight the value of long-term, consistent satellite observations in detecting changes on both global and regional scales. It has been demonstrated that the PCA algorithm is capable of producing highly consistent SO2 data between Aura/OMI and the new generation operational NASA-NOAA polar partnership Suomi-NPP/OMPS UV spectrometer. The algorithm can also be implemented with the NASA/NOAA JPSS-1/OMPS and ESA Sentinel 5 Precursor TROPOMI UV spectrometer, as well as future geostationary sensors such as NASA/TEMPO and Korean GEMS.
These new sensors, with improved spatial and/or temporal resolutions, are expected to be able to detect even smaller SO2 pollution signals than OMI can. The method demonstrated in this study can be used to verify this enhanced detection capability. To this end, SO2 emissions can be derived for known, small sources from SO2 VCDs from these new sensors, and then compared with available high-resolution emission inventories.
Data Sources:
Aura Ozone Monitoring Instrument (OMI) version 1.3 level 2 data were used. OMI has the highest spatial resolution and is the most sensitive to SO2 sources among the satellite instruments of its class. Operational OMI planetary boundary layer SO2 data produced with the principal component analysis (PCA) algorithm (Li et al., 2013) for the period 2005-2015 were used in this study. Retrieved SO2 VCD values are given in Dobson units (DU; 1 DU=2.69?1026 molec km?2).
Li, C., Joiner, J., Krotkov, N. A., and Bhartia, P. K.: A fast and sensitive new satellite SO2 retrieval algorithm based on principal component analysis: Application to the ozone monitoring instrument, Geophys. Res. Lett., 40, 6314-6318, https://doi.org/10.1002/2013GL058134, 2013.
References: Fioletov, V., McLinden, C. A., Kharol, S. K., Krotkov, N. A., Li, C., Joiner, J., Moran, M. D., Vet, R., Visschedijk, A. J. H., and Denier van der Gon, H. A. C.: Multi-source SO2 emission retrievals and consistency of satellite and surface measurements with reported emissions, Atmos. Chem. Phys., 17, 12597-12616, https://doi.org/10.5194/acp-17-12597-2017, 2017.
1.03.2018

