Understanding the vertical and horizontal distribution of tropospheric ozone and how it changes over time is important for determining its radiative forcing and impact on human health. Chemistry climate models provide a tool for quantifying how changing emissions affect ozone concentrations throughout the troposphere, but these models must be validated with observations. We developed a method for comparing global chemistry climate models to the OMI/MLS in-cloud data product. This allows us to evaluate how well a simulation reproduces broad linkages among ozone, convection, and clouds even though the model resolution is much larger than a single cloud.
We use the model simulation to quantify the roles of convection, large-scale transport, and chemistry in changing the ozone distribution at 400 hPa under cloudy versus clear conditions. We find that convection acts to decrease ozone at this level over most of the tropics since it lifts low-ozone air from the surface, but increases ozone in regions of South and East Asia with especially high surface ozone concentrations. Chemistry acts to increase ozone at 400 hPa since production exceeds loss, and this positive tendency is larger over regions with strong emissions of ozone precursors, such as nitrogen oxides (NOx). The NOx concentrations in these regions are higher on cloudy days, further increasing ozone production.
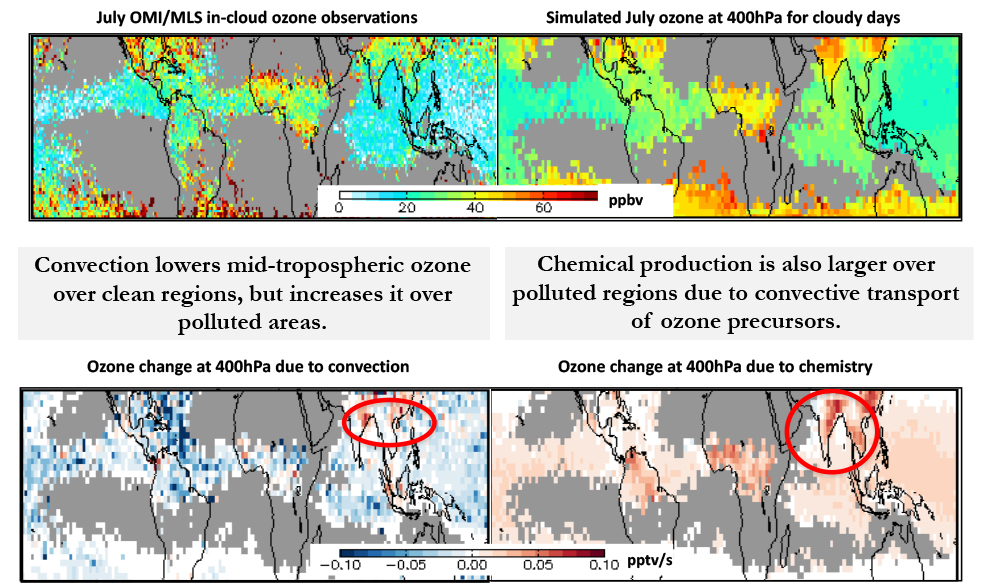
Technical Description of Figure: The OMI/MLS in-cloud ozone product (top, left) compared to the simulated 400 hPa ozone on cloudy days (top, right) in the tropics averaged over July days between 2005 and 2014. Ozone concentrations are in ppbv. Areas with no cloud data are shown in gray. The tendency of simulated ozone at 400 hPa due to convection (bottom, left) and chemistry (bottom, right) in pptv/s, averaged over the same period as the top figure. Regions with no cloud data are shown in gray. Red colors indicate a process is increasing ozone, while blue indicates decrease. Red circles indicate a polluted region where lofting of ozone and its precursors from the surface acts to increase ozone at the 400 hPa level.
Data Sources: The OMI/MLS in-cloud product is derived by differencing the Aura Ozone Monitoring Instrument (OMI) ozone column and the Aura Microwave Limb Sounder (MLS) stratospheric ozone, as described by Ziemke et al. (2017), and represents the average ozone concentrations between 550 hPa and the cloud top. Model results come from the NASA Global Modeling and Assimilation Office (GMAO) and Code 614 Goddard Earth Observing System Chemistry Climate Model (GEOSCCM). We aggregate the simulated ozone at 400 hPa for the OMI overpass time for each grid box for all cloudy days for each July between 2005 and 2014 for comparison to the OMI/MLS in-cloud climatology. A day is considered cloudy for a given grid box if the model's radiative cloud fraction at that location exceeds 0.4 between 350 and 400 hPa.
References: Strode, S. A., A. R. Douglass, J. R. Ziemke, M. Manyin, J. E. Nielsen and L. D. Oman (2017), A model and satellite-based analysis of the tropospheric ozone distribution in clear versus convectively cloudy conditions. Journal of Geophysical Research: Atmospheres, 122, doi:10.1002/2017JD27015.
5.29.2018

