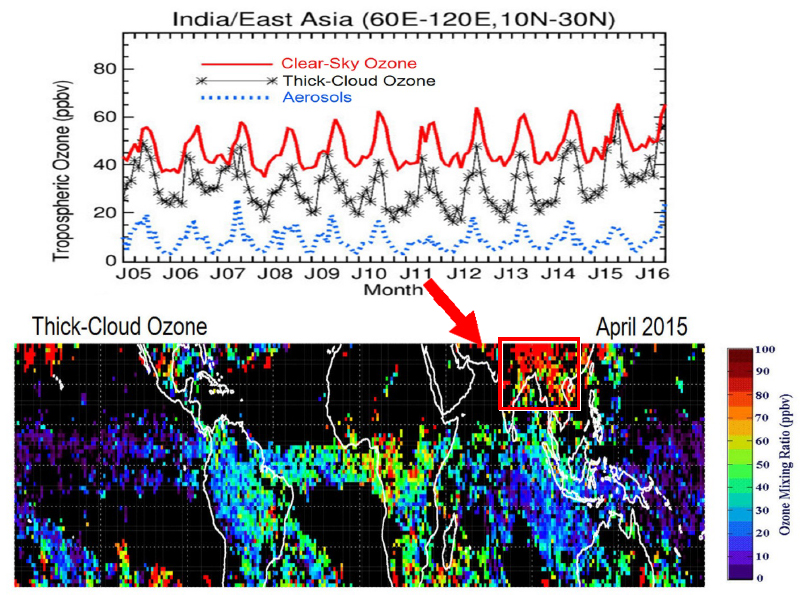
The time series of Aura OMI/MLS clear-sky tropospheric ozone (red curve), thick-cloud ozone (black asterisk curve), and OMI Aerosol Index (blue dotted curve) for a region of India / east Asia. Units for ozone are ppbv. Thick-cloud ozone represents mean volume mixing ratio for deep convective cloud pixels (radiative cloud fractions = 100%) while clear-sky ozone represents mean volume mixing ratio for pixels with radiative cloud fractions < 30%. Black regions in the contour plot denote regions where there are not sufficient number of deep convective clouds for deriving thick-cloud ozone measurements.
Characterizing ozone in thick clouds is an important step for quantifying relationships of ozone with tropospheric H2O, OH production, and cloud microphysics/transport properties. Measuring ozone in deep convective clouds from either aircraft or balloon ozonesondes is largely not possible due to extreme meteorological conditions associated with these clouds; however, it is possible to determine ozone in thick clouds using backscattered solar UV radiation measured by satellite instruments such as OMI.
The cloud-ozone measurements reveal many key features including: persistent low ozone concentrations in the tropical Indian Ocean and Pacific Ocean of ~10 ppbv or less; concentrations of up to 60 pphv or greater over landmass regions of South America, southern Africa, Australia, and India/east Asia; connections with tropical ENSO events; and intra-seasonal/Madden-Julian Oscillation (MJO) variability. Analysis of co-incident OMI aerosol measurements further suggests a direct cause and effect relation between boundary-layer pollution and elevated ozone inside thick clouds over land-mass regions including southern Africa and India/east Asia.
Our cloud-ozone data product is generated by combining profile ozone from the Aura Microwave Limb Sounder (MLS) with both column ozone and cloud parameter measurements from the Aura Ozone Monitoring Instrument (OMI). These “cloud-ozone” measurements represent the mean ozone concentration (in units ppbv) of ozone lying in the upper levels of deep convective clouds between 550 hPa and cloud top. The time period covered for this first version of the cloud-ozone data is October 2004 through April 2016 with spatial coverage from 30oS to 30oN. This cloud-ozone data product is the first of its kind and is made available and free for the public via ftp://jwocky.gsfc.nasa.gov/. We acknowledge greatly the Aura MLS and OMI instrument and algorithm teams for their extensive satellite data included in our study. OMI is a Dutch–Finnish contribution to the Aura mission.
References: Ziemke, J. R., S. A. Strode, A. R. Douglass, J. Joiner, A. Vasilkov, L. D. Oman, J. Liu, S. E. Strahan, P. K. Bhartia, D. P. Haffner (2017), A Cloud-Ozone Data Product from Aura OMI and MLS Satellite Measurements, Atmos. Meas. Tech., 10, 4067–4078, https://doi.org/10.5194/amt-10-4067-2017.
6.2019

