The Smithsonian Institution Global Volcanism Program (GVP) is the world's most authoritative source of information on global volcanic activity, both for the scientific community and the general public. The GVP Volcanoes of the World (VOTW) database is the most comprehensive record of Holocene volcanic activity available. To develop the E3 application, volcanic SO2 data from NASA satellites (TOMS, OMI, OMPS) was added to the VOTW database for the first time, where it will be publicly accessible to database users. This will significantly increase the visibility of NASA data and permit broader use of the data for public outreach and scientific analysis. Joint analysis of volcanic eruption records, SO2 emission data and earthquake frequency could yield new insight into geological and volcanic processes.
Visit the Smithsonian's "Eruptions, Earthquakes, & Emissions" web site
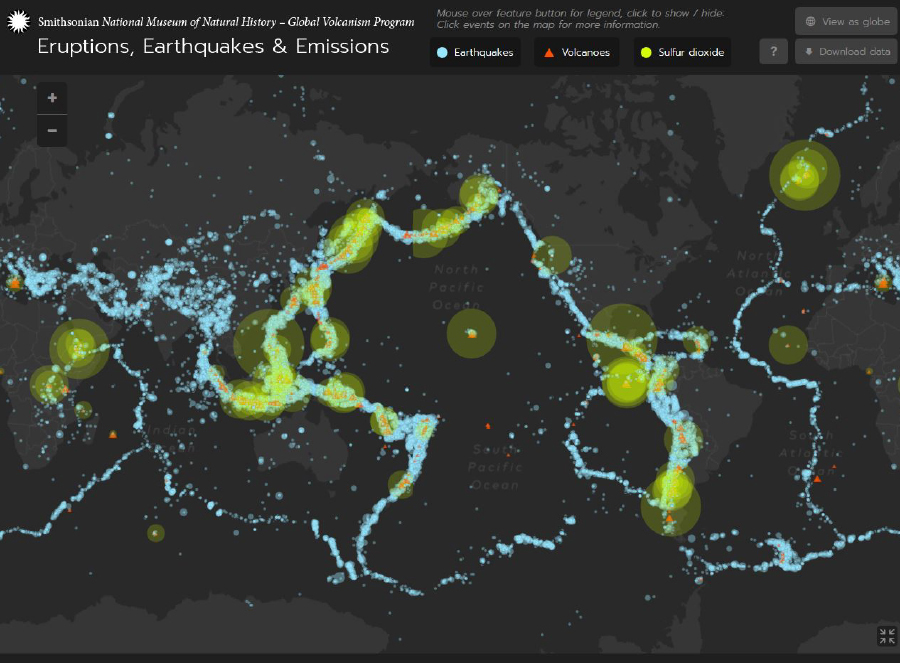
Above is a a screenshot of the Smithsonian Institution Eruptions, Earthquakes & Emissions (E3) web application showing all eruptions and earthquakes. The green represents the Sufur dioxide data from NASA. All volcanoes with recorded eruptions (red triangles), SO2 emissions (yellow circles; circle size is proportional to SO2 emissions measured by TOMS, OMI or OMPS) and earthquakes (blue dots) shown. The web app shows an animated time sequence of these events from 1960 to present. NASA volcanic SO2 data are available from 1978.
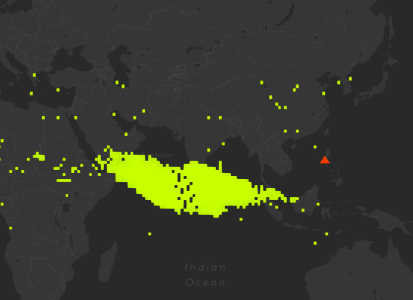
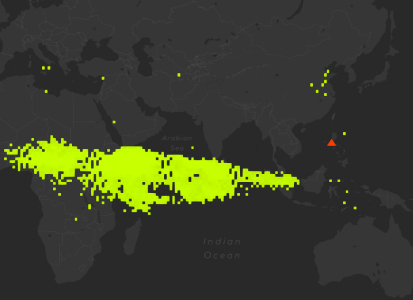
The application can be paused at any time to view animations of volcanic SO2 cloud transport after major eruptions (see below). The images below show two screenshots from an animation of the 1991 Pinatubo (Philippines) volcanic SO2 cloud.
The SO2 emissions data available through a new GVP search page (https://volcano.si.edu/search_emission.cfm) and related spreadsheet download as well as being displayed on a new tab on the volcano profile pages. This is the same data that is being presented on the E3 webapp, but the direct download includes more information than that available through the app download option.
Data Sources: Total Ozone Mapping Spectrometer (TOMS), Ozone Monitoring Instrument (OMI) and Ozone Mapping and Profiler Suite (OMPS) observations of volcanic SO2 clouds between 1978 and 2015. New OMI and OMPS volcanic SO2 products produced by the Goddard OMI SO2 team at code 614 (Can Li (614/ESSIC) and Nickolay A. Krotkov (PI-614) are described in this paper:
References: Global Volcanism Program (2016). Eruptions, Earthquakes & Emissions, v. 1.0 (internet application). Smithsonian Institution. Accessed 15 Feb 2017 (https://volcano.si.edu/E3/ ).
Li, C., Krotkov, N. A., Carn, S., Zhang, Y., Spurr, R. J. D., and Joiner, J. (2017). New-generation NASA Aura Ozone Monitoring Instrument (OMI) volcanic SO2 dataset: algorithm description, initial results, and continuation with the Suomi-NPP Ozone Mapping and Profiler Suite (OMPS), Atmos. Meas. Tech., 10, 445-458, doi:10.5194/amt-10-445-2017.
2.17.2017

