NO2 remains an important traffic-related pollutant associated with both short- and long-term health effects. de Hoogh et al. conducted one of the first studies showing the potential of using earth observation data to develop robust models with fine-scale spatial (100 × 100 m2) and temporal (daily) variation of NO2 across Switzerland from 2005 to 2016. The novelty of this study is in demonstrating that methods originally developed for particulate matter can also successfully be applied to NO2. The predicted NO2 concentrations will be made available to facilitate health research in Switzerland.
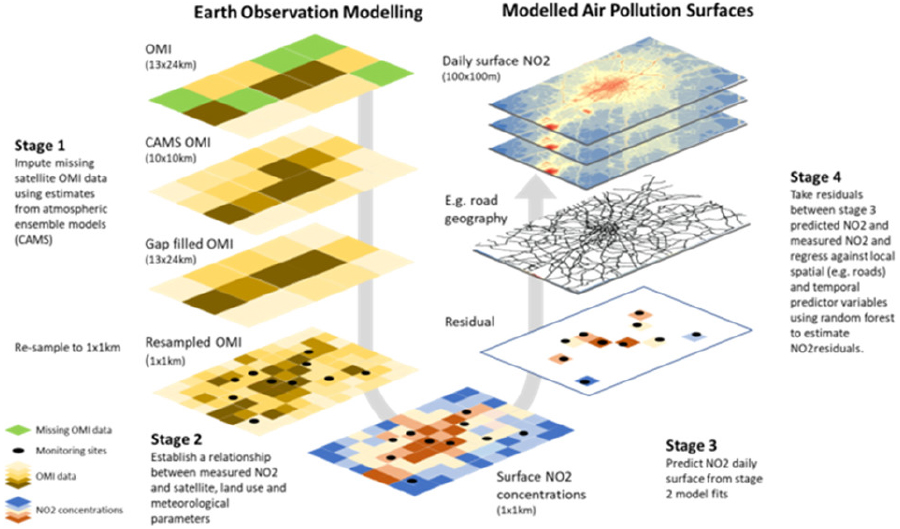
de Hoogh et al., Environmental Science & Technology 2019 53 (17), 10279-10287, DOI: 10.1021/acs.est.9b03107
Satellite NO2 columns have been widely used in assessing bottom-up NOx emissions from large cities, industrial facilities, and power plants. However, the satellite data fail to identify strong NOx emissions from sources less than the satellite’s pixel size, while significantly underestimating their emission intensities (i.e., smoothing effect). Lee et al. reconstruct the OMI tropospheric NO2 vertical column density (VCD) over South Korea to a fine-scale product (3 × 3 km2) using a conservative spatial downscaling method. Their findings highlight a potential capability of the fine-scale reconstructed OMI NO2 product in detecting directly strong NOx emissions, and emphasize the inherent methodological uncertainty in interpreting the reconstructed satellite product at a high-resolution grid scale.
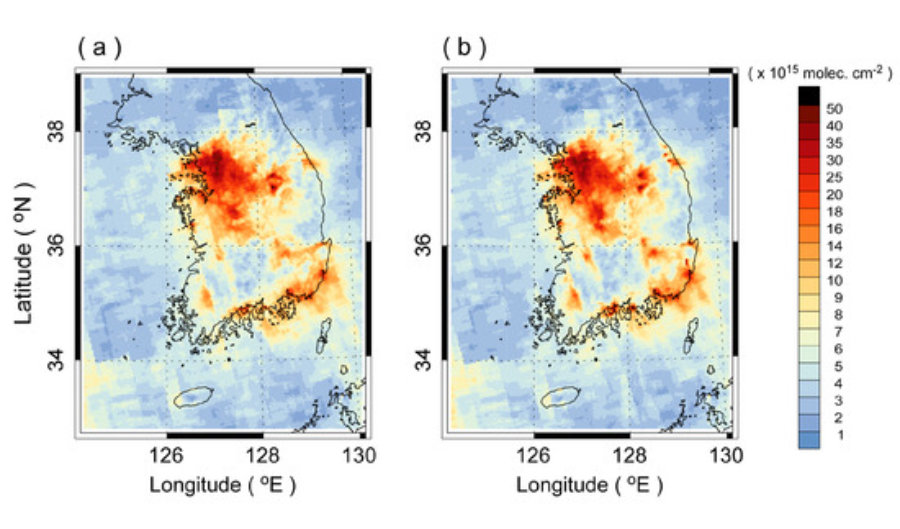
The spatial distributions of the fine-scale reconstructed OMI NO2 VCDs over South Korean obtained by applying the spatial-weight kernels from two AQ models: (a) WRF-Chem and (b) WRF/CMAQ.
Lee et al., Remote Sensing, 2019 11(16), 1861, https://doi.org/10.3390/rs11161861.
References:
Kees de Hoogh, Apolline Saucy, Alexandra Shtein, Joel Schwartz, Erin A. West, Alexandra Strassmann, Milo Puhan, Martin Röösli, Massimo Stafoggia, and Itai Kloog, Predicting Fine-Scale Daily NO2 for 2005–2016 Incorporating OMI Satellite Data Across Switzerland, Environmental Science & Technology, 2019 53 (17), 10279-10287, DOI: 10.1021/acs.est.9b03107
Jae-Hyeong Lee, Sang-Hyun Less, and Hyun Cheol Kim, Detection of Strong NOx Emissions from Fine-scale Reconstruction of the OMI Tropospheric NO2 Product, Remote Sensing, 2019 11(16), 1861, https://doi.org/10.3390/rs11161861.
11.2019

