Aura OMI sulfur dioxide (SO2) observations from 2005 to 2017 (right), in the recently released 2018 EPA Air Trends Report, demonstrate the effect of pollution controls on US air quality with significant reductions in SO2 near coal-burning power plants.
In the 2017 EPA Air Trends Report, OMI nitrogen dioxide (NO2 observations similarly showed a reduction in US NOx emissions.
Recently, a 2018 international air transport emissions report from Texas Commission on Environmental Quality (TCEQ) identified large SO2 and NO2 sources in Mexico, which could affect Texas air quality, with OMI observations.
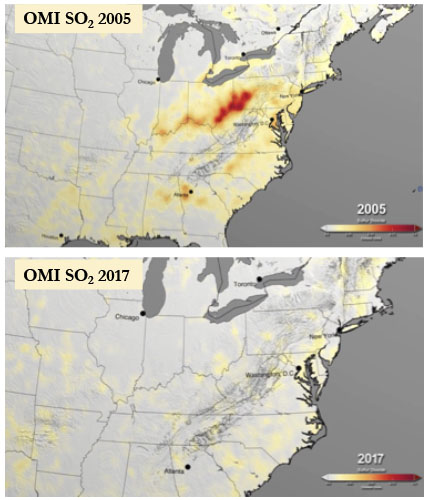
OMI SO2 levels (units = Dobson Unit, DU) for 2005 (Top) and 2017 (Bottom) over the Eastern U.S used in the animation of the 2018 EPA Air Trends Report.
Scientific significance, societal relevance, and relationships to future missions:
OMI data are used in a variety of air quality applications, such as monitoring trends in air pollution, including the efficacy of controls to remove SO2 from thermal power plant emissions as in this example. The upcoming NASA TEMPO satellite will be in geosynchronous orbit, which will give an unprecedented view of how SO2 and NO2 concentrations evolve throughout the day.
Data Sources:
Aura OMI SO2 data (courtesy of Chris McLinden, Environment Canada) from 2005-2017 developed into an animation by NASA Goddard. The uncertainties associated with the data are larger for smaller sources and vice versa. Therefore, some SO2 signals in remote areas may simply be data artifacts. Additional information on this data can be found at the NASA Goddard Global Sulfur Dioxide Monitoring Homepage: https://so2.gsfc.nasa.gov.
References: The original Aura OMI 2005—2017 SO2 animation for the U.S., as well as other countries, can be found at: https://airquality.gsfc.nasa.gov/particulate-matter. The 2018 EPA Air Trends Report that shows this animation is found at: https://gispub.epa.gov/air/trendsreport/2018/. The 2017 EPA Air Trends Report using OMI NO2 observations is located at: https://gispub.epa.gov/air/trendsreport/2017/. TCEQ report, entitled “Modeling Inventories for Mexico and Caribbean Countries to Support Quantitative Analysis of International Transport Impacts on Ozone Design Values and Regional Haze”.
8.2018

