To facilitate scientific research using Ozone Monitoring Instrument (OMI) Nitrogen Dioxide (NO2) data, the US OMI team at GSFC developed a web-based monitoring system that shows time series for over 200 world cities and animated maps for larger regions. This website is primarily for scientists to quickly view recent data in relation to historical data. The time series and maps are updated daily.
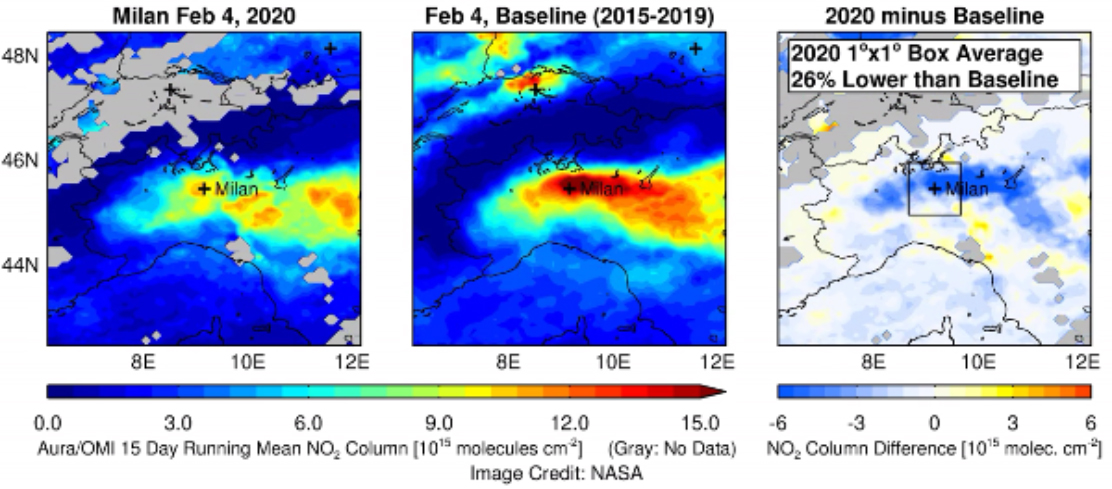
As an example, the images below are for the region of Milan, Italy, and are part of an animation that begins on January 1st, 2020. The map on the left shows the 15-day running mean of OMI NO2 for 2020 and the average running mean for 2015-2019 is shown in the middle. The map on the right shows the difference between 2020 and the average of 2015-2019. While weather variations play a role in modulating OMI NO2 levels in the atmosphere, the large decreases shown in the maps are consistent with efforts to slow the spread of COVID-19. Further analysis is required to rigorously quantify the amount of the change in NO2 levels associated with changes in pollutant emissions versus natural variations in weather.
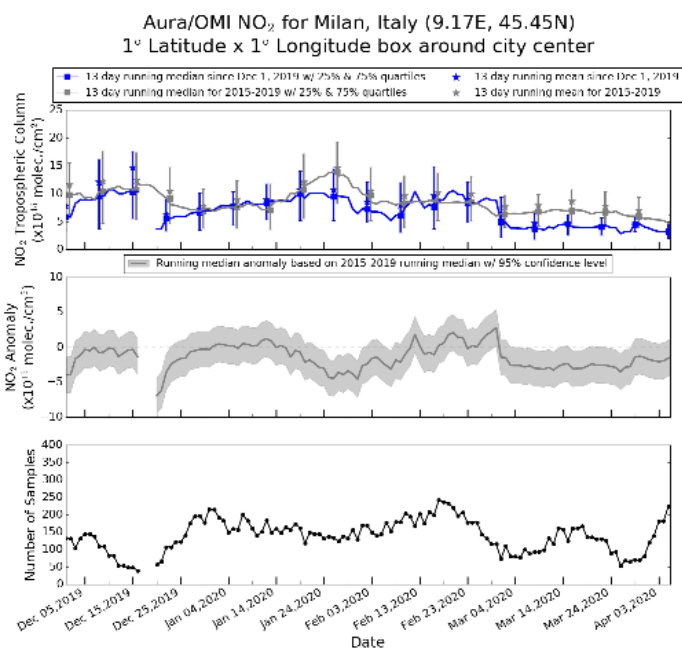
The plots (below) show OMI NO2 data over Milan, Italy. The top plot shows the 13-day running median for the last five months along with the 13-day running median for the last five years for comparison. The anomaly is shown in the middle plot and the number of data points in the bottom plot. The plots take advantage of OMI’s long historical record to place recent changes, such as associated with efforts to slow the spread of COVID-19, into historical context.
Technical description of figure:
The images above shows satellite data of NO2 from the Aura Ozone Monitoring Instrument (OMI) over the Northeast United States in March. The image on the left shows the mean of the period from 2015 through 2019, while the image on the right shows the mean for 2020. Though variations in weather from year to year cause variations in the monthly means for individual years, March 2020 shows the lowest values as compared to any of the monthly values for March during the OMI data record, which spans 2005 to present. In fact, the data indicate that the NO2 levels in March 2020 are about 30% lower on average across the region of the I-95 corridor from Washington, DC to Boston than when compared to the mean of 2015 to 2019. Caution: Further analysis is required to rigorously quantify the amount of the change in NO2 levels associated with changes in pollutant emissions versus natural variations in weather. The images are free and publicly-available and may be downloaded.
Scientific significance, societal relevance, and relationships to future missions:
Animated maps: The images are for the region of Milan, Italy that begins on January 1st, 2020. The map on the left shows the 15-day running means of OMI NO2 for 2020 and the average running mean for 2015-2019 is shown in the middle. The map on the right shows the difference between 2020 and the average of 2015-2019. While weather variations play a role in modulating OMI NO2 levels in the atmosphere, the large decreases shown in the maps are consistent with efforts to slow the spread of COVID-19. Caution: Further analysis is required to rigorously quantify the amount of the change in NO2 levels associated with changes in pollutant emissions versus natural variations in weather.
Time series plots: The time-line plots show OMI NO2 data over Milan, Italy. The top plot shows the 13-day running median (and mean) for the last five months along with the 13-day running median for the last five years for comparison along with 25th and 75th percentiles. The anomaly is shown in the middle plot along with a confidence interval and the number of data points in the bottom plot. The plots take advantage of OMI’s long historical record to place recent changes, such as associated with efforts to slow the spread of COVID-19, into historical context.
Data Sources:
Satellite-derived emission estimates are based on NO2 measurements from the Aura Ozone Monitoring Instrument (OMI). OMI is a Dutch–Finnish contribution to the NASA Aura mission.
References: Joanna Joiner (NASA), Bryan Duncan (NASA), GSFC Aura Ozone Monitoring Instrument (OMI) Team
5.2020

