Technical description of figure:
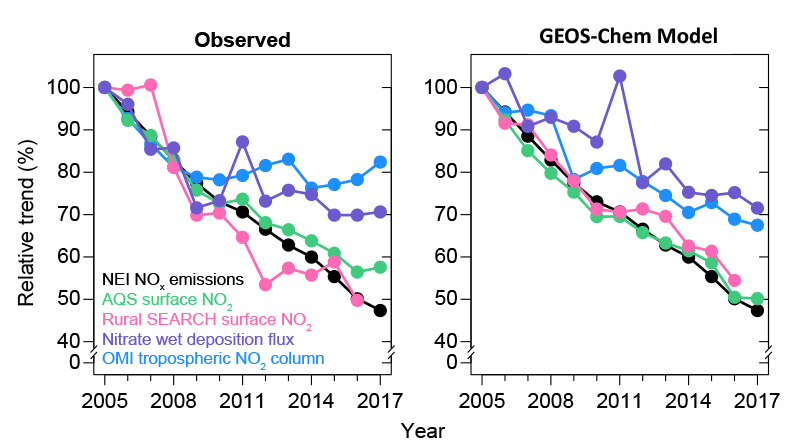
Relative trends since 2005 of NEI NOx emissions, OMI tropospheric NO2 columns, surface NO2 concentrations, and nitrate wet deposition fluxes averaged over the contiguous US. The left panel shows observations for sites with continuous annual records for 2005-2017 (2016 for SEARCH) and the right panel shows the GEOS-Chem model values sampled at the corresponding sites. NEI NOx emissions are the same in both panels.
Scientific significance, societal relevance, and relationships to future missions:
Following increasingly stringent emission controls targeted at improving air quality since the early 2000s, the EPA NEI reports a steady decrease in US fuel combustion emissions of nitrogen oxides (NOx) over the 2005-2017 period. Tropospheric NO2 columns over the US observed by OMI, presumed to be a proxy for NOx emissions if most most of the information in the NO2 tropospheric column originates from the boundary layer, show a leveling off after 2009, leading to the suggestion that the NEI emission trend is in error and that related air quality gains have halted.
Here we conduct a comprehensive analysis of 2005-2017 trends in US NOx emissions by using the GEOS-Chem chemical transport model to concurrently interpret the trends observed in OMI NO2 columns, nitrogen wet deposition fluxes, and surface observations of NO2 and ozone. We show the flattening of the OMI NO2 trend is in fact not inconsistent with the sustained decrease in NOx emissions reported by the NEI and that the NEI emission trend is consistent with other atmospheric observations of NOx and ozone trends. Our results demonstrate the importance of accounting for the free tropospheric NO2 background when using satellite observations of NO2 columns to infer NOx emissions and their trends. The concern is minor in highly polluted areas where NOx emissions are sufficiently high to dominate over the background influence. In the US, however, NOx emissions have now decreased to the point that NO2 columns over non-urban areas are mostly contributed by the free tropospheric background. Accounting for this poorly understood background will become increasingly important as NOx emissions continue to decrease in the developed world, and in tropical regions that are undergoing rapid development but have a deep troposphere and intense lightning. The upcoming TEMPO mission will need to properly account for free tropospheric NO2 in their retrieval and will be able to leverage the cloud-slicing technique developed for OMI to separate boundary layer and free tropospheric NO2 with higher spatial and temporal resolution.
Data sources:
OMI observations of tropospheric NO2 columns are from the NASA operational retrieval level 2 version 3.0 (https://mirador.gsfc.nasa.gov/; Krotkov et al., 2017) after removing cloudy scenes (cloud radiance fraction > 0.5), bright surfaces (surface reflectivity > 0.3), and observations affected by the so-called row anomaly (Dobber et al., 2008). NOx emissions are from the US EPA National Emission Inventory (NEI; https://www.epa.gov/air-emissions-inventories/air-pollutant-emissions-trends-data). Surface NO2 data are from the mainly urban US EPA Air Quality System (AQS) (https://www.epa.gov/aqs; Demerjian, 2000) sites and two rural sites in the southeast from the Southeastern Aerosol Research and Characterization Study (SEARCH) network (https://www.dropbox.com/sh/o9hxoa4wlo97zpe/AACbm6LetQowrpUgX4vUxnoDa?dl=0; Hansen et al., 2003; Edgerton et al., 2006), and nitrate wet deposition observations are from the National Acid Deposition Program (NADP; https://nadp.slh.wisc.edu/data/NTN/). Model results are from the GEOS-Chem global 3-D chemical transport model version 11-02c (http://www.geos-chem.org) using NASA MERRA-2 assimilated meteorological data (Gelaro et al., 2017) at the native 0.5°× 0.625° horizontal resolution over North America and adjacent oceans with dynamic boundary conditions from a global simulation.
References: Silvern, R.F., Jacob, D.J., Mickley, L.J., Sulprizio, M.P., Travis, K.R., Marais, E.A., Cohen, R.C., Laughner, J.L., Choi, S., Joiner, J., and Lamsal, L.N.: Using satellite observations of tropospheric NO2 columns to infer long-term trends in US NOx emissions: the importance of accounting for the free tropospheric NO2 background, Atmospheric Chemistry and Physics, 19, 8863–8878, https://doi.org/10.5194/acp-19-8863-2019, 2019 .
7.2019

