Over the past several weeks, the Northeast US has seen significant reductions in air pollution over its major metropolitan areas. These recent improvements in air quality have come at a high cost, as communities grapple with widespread lockdowns and shelter-in-place orders as a result of the spread of COVID-19.
One air pollutant, nitrogen dioxide (NO2 ), is primarily emitted from burning fossil fuels (diesel, gasoline, coal). If processed and interpreted carefully, NO2 levels observed from space serve as an effective proxy for NO2 levels at Earth's surface.
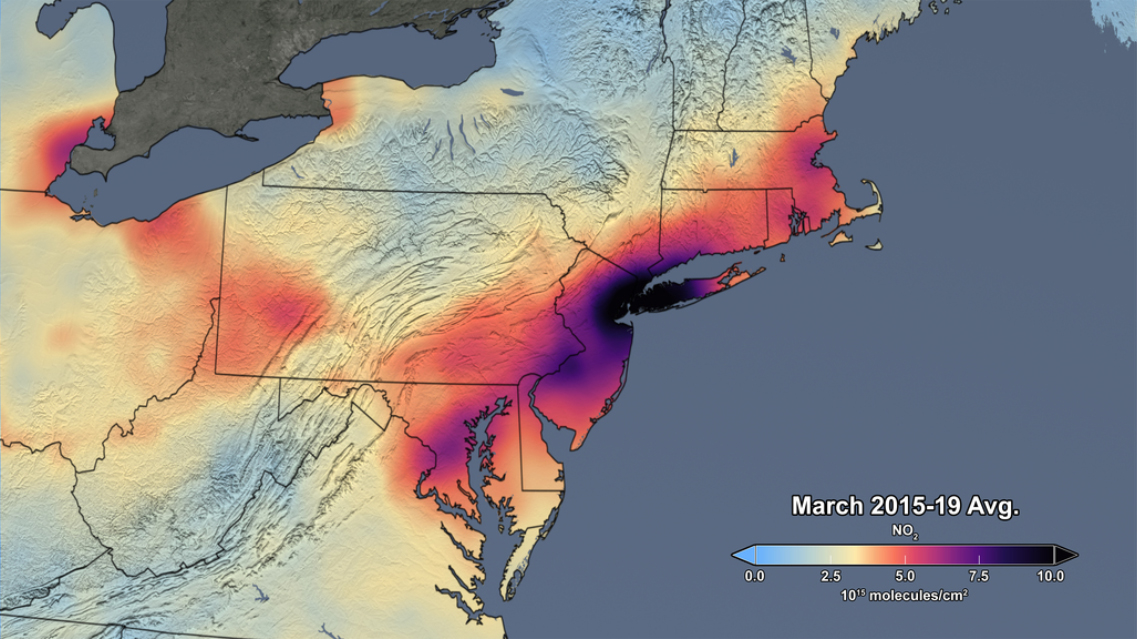
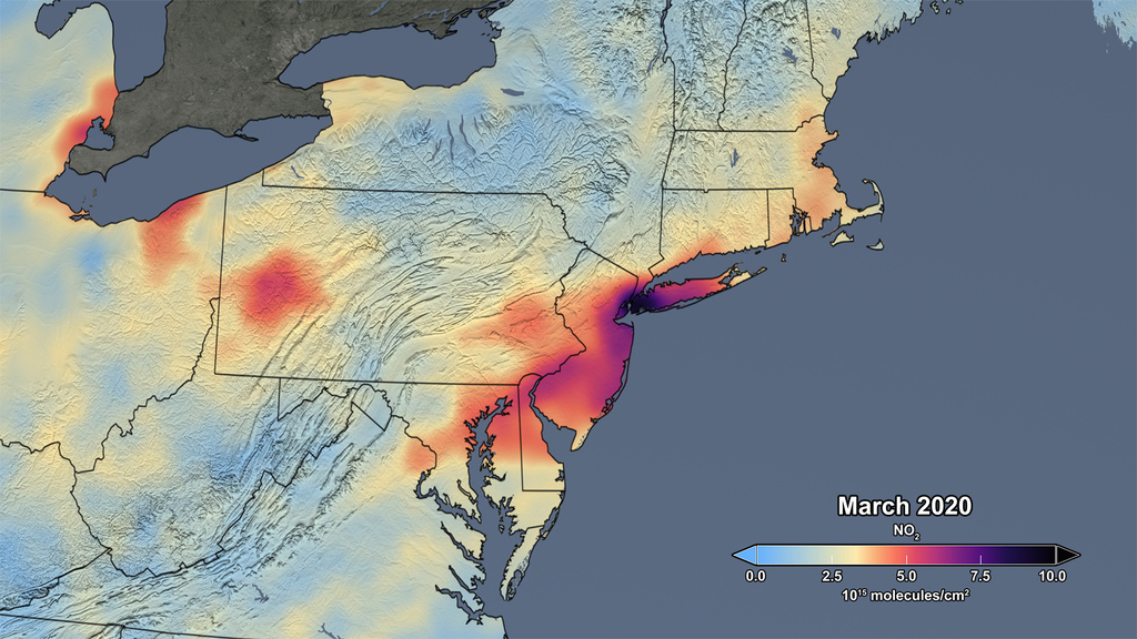
The images show satellite data of NO2 from the Aura Ozone Monitoring Instrument (OMI) over the Northeast US in March. The top image shows the mean of the period from 2015 through 2019, while the bottom image on the right shows the mean for 2020.
Though variations in weather from year to year cause variations in the monthly means for individual years, March 2020 shows the lowest values as compared to any of the monthly values for March during the OMI data record, which spans 2005 to present. In fact, the data indicate that the NO2 levels in March 2020 are about 30% lower on average across the region of the I-95 corridor from Washington, DC to Boston than when compared to the mean of 2015 to 2019. The images are free and publicly-available and may be downloaded.
Caution: Further analysis is required to rigorously quantify the amount of the change in NO2 levels associated with changes in pollutant emissions versus natural variations in weather.
Technical description of figure:
The images above shows satellite data of NO2 from the Aura Ozone Monitoring Instrument (OMI) over the Northeast United States in March. The image on the left shows the mean of the period from 2015 through 2019, while the image on the right shows the mean for 2020. Though variations in weather from year to year cause variations in the monthly means for individual years, March 2020 shows the lowest values as compared to any of the monthly values for March during the OMI data record, which spans 2005 to present. In fact, the data indicate that the NO2 levels in March 2020 are about 30% lower on average across the region of the I-95 corridor from Washington, DC to Boston than when compared to the mean of 2015 to 2019. Caution: Further analysis is required to rigorously quantify the amount of the change in NO2 levels associated with changes in pollutant emissions versus natural variations in weather. The images are free and publicly-available and may be downloaded.
Scientific significance, societal relevance, and relationships to future missions:
The OMI NO2 data will enable scientific and applied research. The following are a few examples: :
Data Sources:
Satellite-derived emission estimates are based on NO2 measurements from the Aura Ozone Monitoring Instrument (OMI). OMI is a Dutch–Finnish contribution to the NASA Aura mission.
References: Joanna Joiner (NASA), Bryan Duncan (NASA), GSFC Aura Ozone Monitoring Instrument (OMI) Team
5.2020

