On April 12, 2016, President Obama uses OMI NO2 data to explain how pollution affects our planet
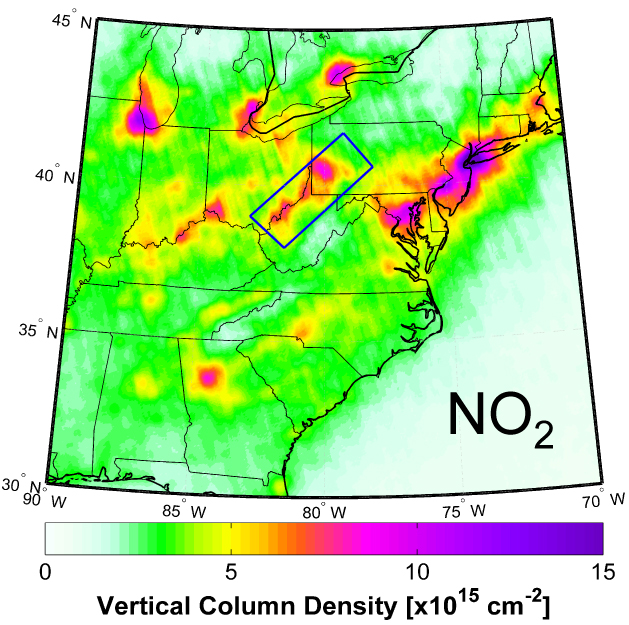
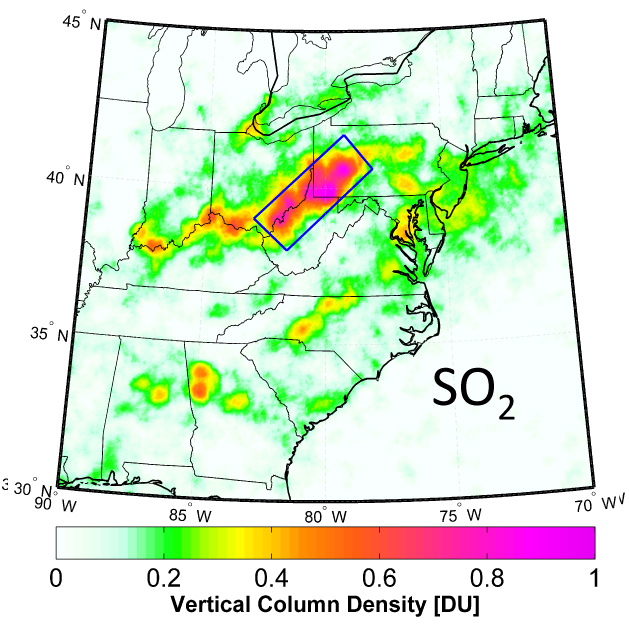
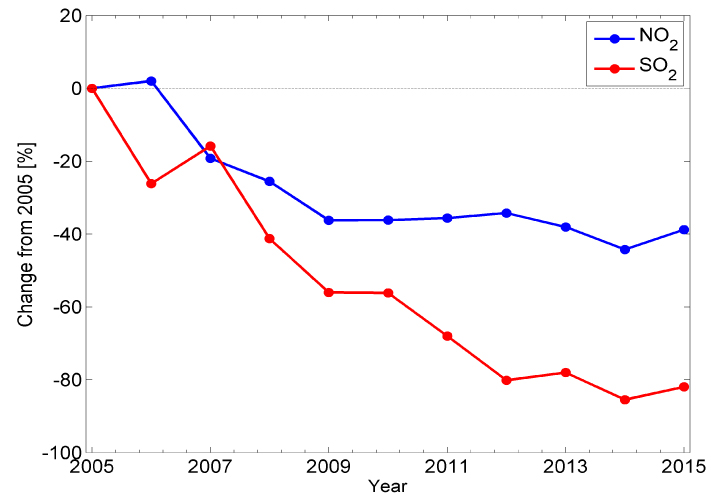
Over US NO2 and SO2 pollution have decreased by 40% & 80%, "thanks in large part to new rules to protect our air".
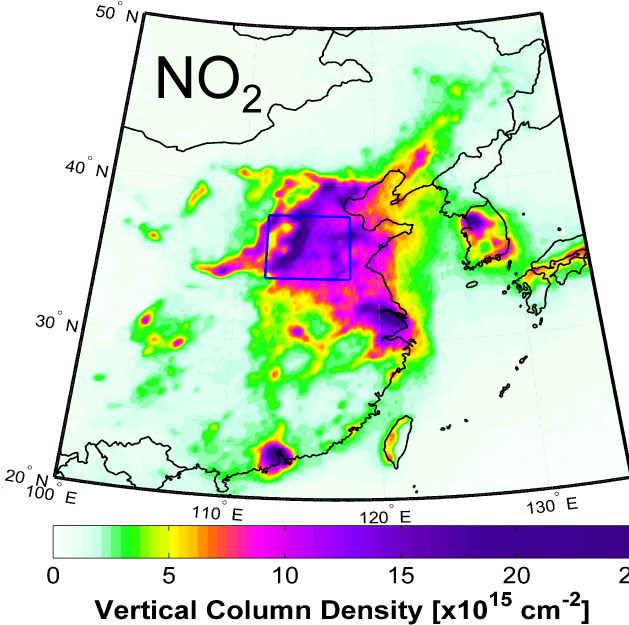
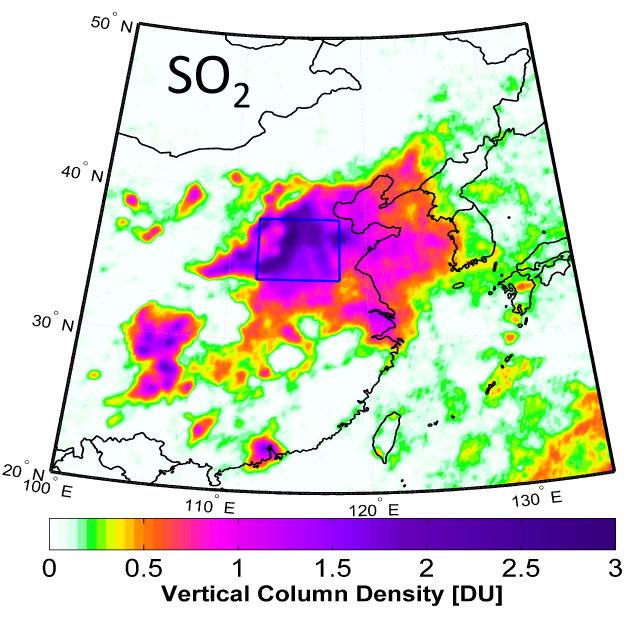
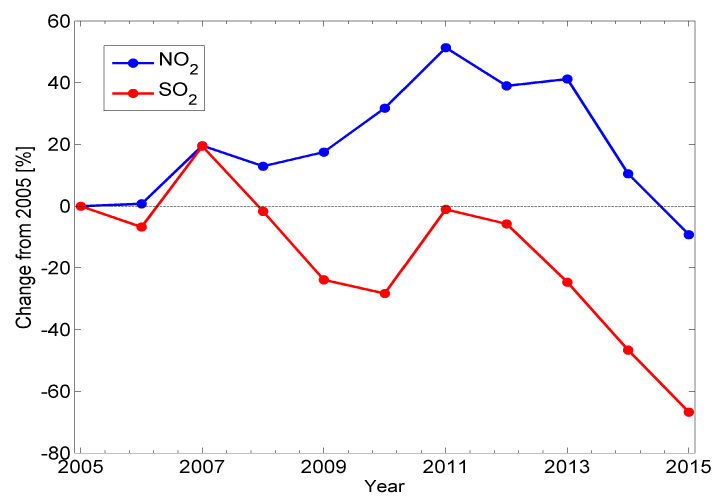
NO2 pollution over NE China has declined by 50% since its peak in 2011 and is now at the same level as in 2005. SO2 pollution has declined by 80% since its peak in 2007 and is now 60% less than in 2005.
← ( SO2 from volcanic eruptions)
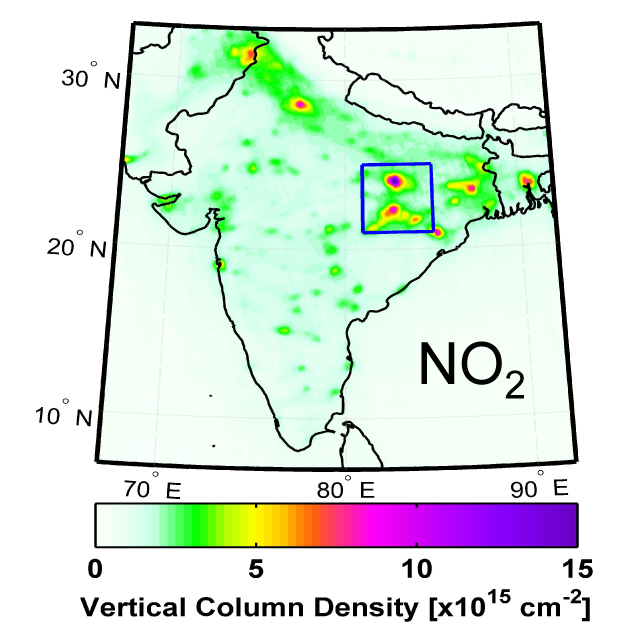
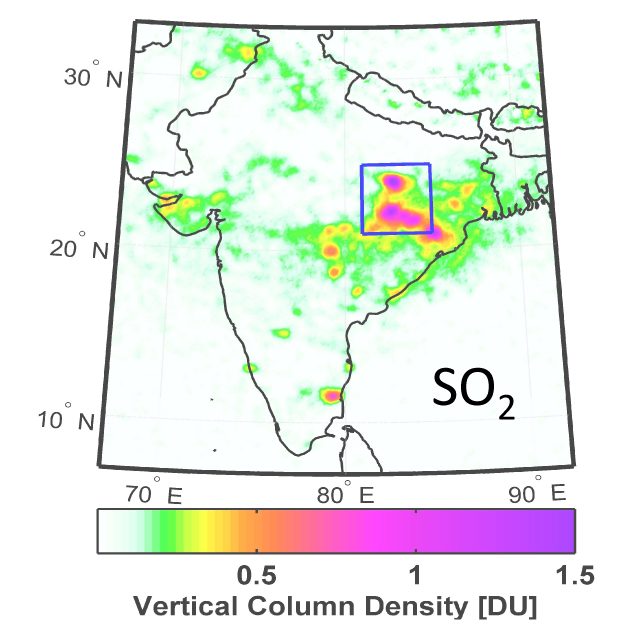
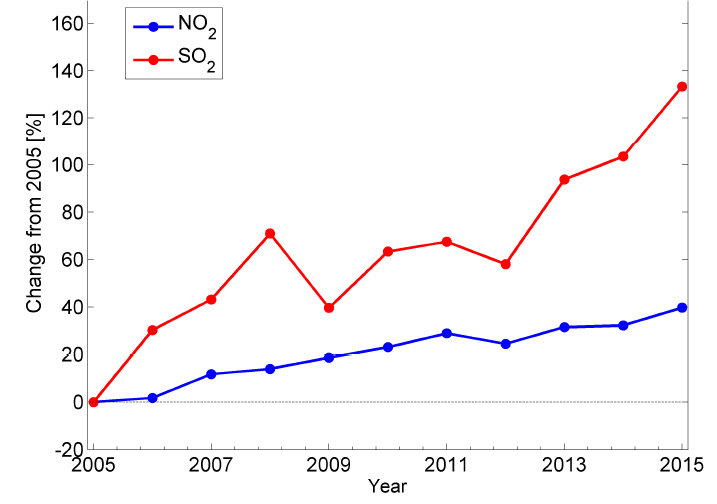
Over NE India where many new coal-fired power plants were built, NO2 pollution increased by ~40%, while SO2 pollution increased by 140%
Technical Description of Figures:
OMI regional NO2 maps show annual average tropospheric NO2 vertical column density [1015 molecules cm-2].
OMI regional SO2 maps show annual average boundary level SO2 vertical column density [Dobson Units].
1 Dobson Unit (DU) = 2.69x10¹⁶ [molecules cm-2].
Timeseries plots show percent change in annual average NO2 and SO2 relative to the 2005 for regions outlined in the maps
Scientific significance, societal relevance, and relationships to future missions:
Space-based monitoring plays an increasingly important role in the science of tropospheric chemistry and air quality applications to help mitigate anthropogenic and natural impacts on climate, sensitive ecosystems, and human health. It is essential to continue and maintain overlapping long-term satellite data records. The baseline established during the first 11 years of OMI is invaluable for the interpretation of measurements from future satellite atmospheric chemistry missions.
The OMI measurements will be continued by the TROPOspheric Monitoring Instrument (TROPOMI), which is planned for launch on ESA's Sentinel 5 Precursor (S5P) satellite in 2016. TROPOMI is part of the European Sentinel series that will continue the global pollution data record for another 20 years . The space-based capabilities for air quality applications will be further enhanced by the addition of higher-ground resolution hourly observations from the three geostationary satellites over North America (NASA's first EV-I Tropospheric emissions: monitoring of pollution (TEMPO), over Europe (ESA's and Copernicus Sentinel 4 UVN ) and East Asia (Geostationary Environment Monitoring Spectrometer (GEMS) on board the GeoKOMPSAT satellite). This atmospheric composition constellation will allow for unprecedented observations of the key pollutants in the atmosphere during next decade.
Data Sources:
Aura Ozone Monitoring Instrument (OMI) SO2 and NO2 NASA standard products. The Dutch - Finnish built OMI instrument is part of the NASA's EOS Aura satellite payload. The OMI project is managed by KNMI (PI Pieternel Levelt) and the Netherlands Space Agency (NSO).
The Planetary Boundary Layer SO2 product (PBL OMSO2 v1.2.0) is publicly available from the NASA Goddard Earth Sciences (GES) Data and Information Services Center (DISC) [https://disc.sci.gsfc.nasa.gov/Aura/data-holdings/OMI/omso2_v003.shtml].
The NASA standard SP tropospheric NO2 product (OMNO2 version 2.1) is publicly available from NASA GES DISC at https://disc.sci.gsfc.nasa.gov/Aura/data-holdings/OMI/omno2_v003.shtml.
References: Krotkov, N. A., McLinden, C. A., Li, C., Lamsal, L. N., Celarier, E. A., Marchenko, S. V., Swartz, W. H., Bucsela, E. J., Joiner, J., Duncan, B. N., Boersma, K. F., Veefkind, J. P., Levelt, P. F., Fioletov, V. E., Dickerson, R. R., He, H., Lu, Z., and Streets, D. G.: Aura OMI observations of regional SO2 and NO2 pollution changes from 2005 to 2015, Atmos. Chem. Phys., 16, 4605-4629, doi:10.5194/acp-16-4605-2016, 2016. Duncan, B. N., Lamsal, L. N., Thompson, A. M., Yoshida, Y., Lu, Z., Streets, D. G., Hurwitz, M. M. and Pickering, K. E.: A space-based, high-resolution view of notable changes in urban NOx pollution around the world (2005-2014), J. Geophys. Res. Atmos., 121(2), 976-996, doi:10.1002/2015JD024121, 2016.

