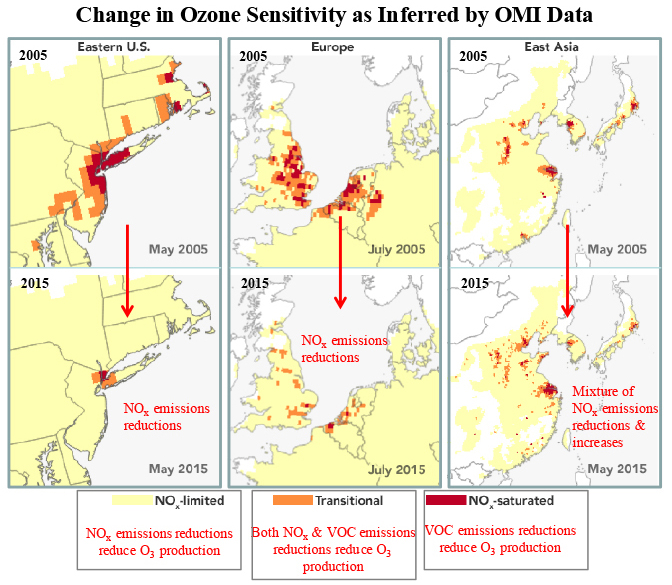
The top row shows OMI HCHO/NO2 for 3 world regions in 2005, while the bottom row shows the same ratio for 2015. In the U.S. and Europe, major decreases in NOx emissions have caused this ratio to increase, indicating that ozone production is more sensitive now vs. a decade ago to further reductions in NOx emissions. The changes in the ratios over East Asia indicate a patchwork of emission changes and concomitant changes in ozone production sensitivities.
We use satellite observations of Aura Ozone Monitoring Instrument (OMI) formaldehyde (HCHO, a marker of VOCs) and NO2 (a marker of NOx) to identify areas that would benefit more from reducing NOx emissions (NOx-limited) versus reducing VOC emissions (VOC-limited).
Observing changes in the ratio of these two precursors over time provides evidence for the success of emission control programs in altering ozone production chemistry.
Scientific significance, societal relevance, and relationships to future missions:
Surface ozone has adverse effects on public health, agriculture, and ecosystems. As a pollutant that is not directly emitted, ozone forms from two classes of precursors: oxides of nitrogen (NOx) and volatile organic compounds (VOCs). We use satellite observations of formaldehyde (HCHO, a marker of VOCs) and NO2 (a marker of NOx) to identify areas that would benefit more from reducing NOx emissions (NOx-limited) versus reducing VOC emissions (VOC-limited). We use a global chemical transport model (GEOS-Chem) to develop a set of HCHO/NO2 that mark the boundaries ("threshold values") between the NOx-limited, transition, and VOC-limited conditions. Satellite instruments do not measure the ground level concentrations but instead sense the vertical column density of the HCHO or NO2 abundances the air between the surface and the instrument in space. We use GEOS-Chem to link the column HCHO/NO2 with ground level HCHO/NO2. Combining model-derived threshold values with a decadal record of satellite observations, we find that major cities over northern midlatitude source regions (e.g., New York, London, and Seoul) show a lengthening of NOx-limited ozone chemistry in the warm season. This trend reflects the NOx emission controls implemented over the past decade. Increasing NOx sensitivity implies that newly implemented regional NOx emission control programs will continue to improve ozone air quality even more so now than they would have a decade ago.
Currently, Aura overpasses once per day in the early afternoon, giving only a "snapshot" of ozone production sensitivity. The upcoming NASA TEMPO mission, which will be in geosynchronous orbit, will allow the hourly evolution of ozone production sensitivity to be studied.
Instruments onboard NOAA's Joint Polar Satellite System (JPSS-2 and -3) will continue the O3 record of MLS, but there are currently no sensors planned to continue the MLS HCl measurements once Aura terminates. Aura was launched in 2004.
Data Sources:
The regime classification uses the ratio of monthly average OMI formaldehyde (HCHO) to nitrogen dioxide (NO2). The HCHO product is the Level-3 HCHO product developed by the the Belgian Institute for Space Aeronomy (BIRA-IASB, version 14). The NO2 product is the Level-3 NASA standard operational NO2 Product (version 2.1) developed at NASA/Goddard Space Flight Center. The HCHO/NO2 values marking the boundaries of the transition regime are derived from a global chemical transport model (GEOS-Chem) that simulates the relationship between the HCHO/NO2 ratio in the model surface layer and the surface O3 response to precursor emission reductions (i.e., two simulations relative to a base case: one in which nitrogen oxide (NOx) emissions are decreased by 20% and one in which non-methane volatile organic compound (NMVOC) emissions are decreased by 20% globally). The surface HCHO/NO2 values are then adjusted further based on the modeled column-to-surface relationships and the average differences between the modeled and satellite-derived columns of HCHO and NO2.
References: Jin X., A.M. Fiore, L.T. Murray, L.C. Valin, L.N. Lamsal, B.N. Duncan, K.F. Boersma, I. De Smedt, G. Gonzalez Abad, K. Chance, and G.S. Tonnesen (2017). Evaluating a space-based indicator of surface ozone-NOx-VOC sensitivity over mid-latitude source regions and application to decadal trends. J. Geophys. Res., 122. https://doi.org/10.1002/2017JD026720.
12.28.2017

