The COVID-19 pandemic created global scale reductions in anthropogenic sources of pollution including important tropospheric ozone precursors such as nitrogen oxides (NOx (NO+NO2 )) and Volatile Organic Compounds (VOC’s). There have been many publications describing the large reductions in pollutants and tropospheric ozone in spring-summer 2020. Their results, using ground-based measurements and model simulations have shown reductions in tropospheric ozone throughout the Northern Hemisphere (NH) averaging around 7% with regional variations ~5-15%.
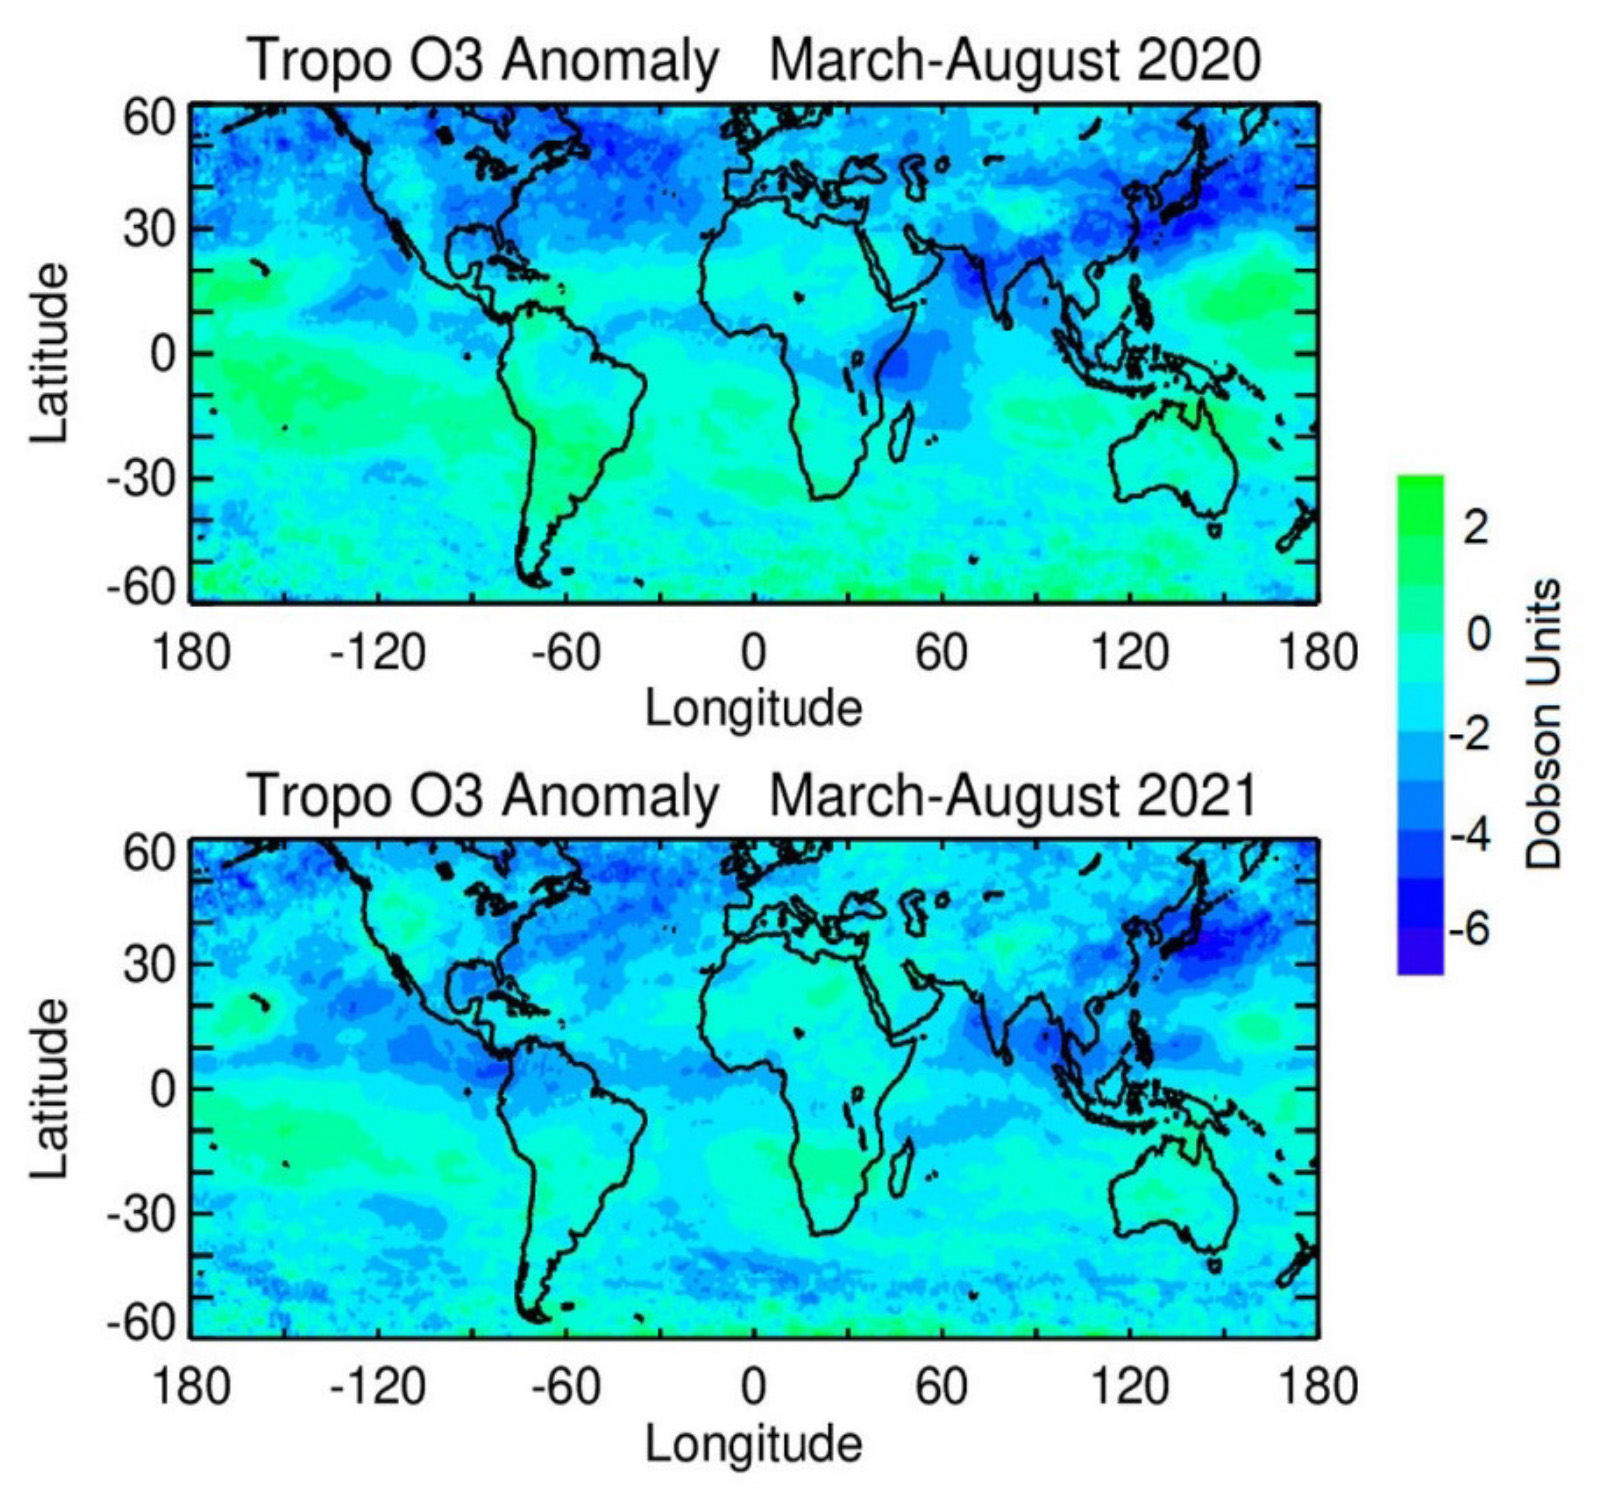
Figure 1: Inter-annual anomalies (based on 2016-2019 average) in tropospheric column ozone (in Dobson Units) for March-August 2020 (top panel) and March-August 2021 (bottom panel).
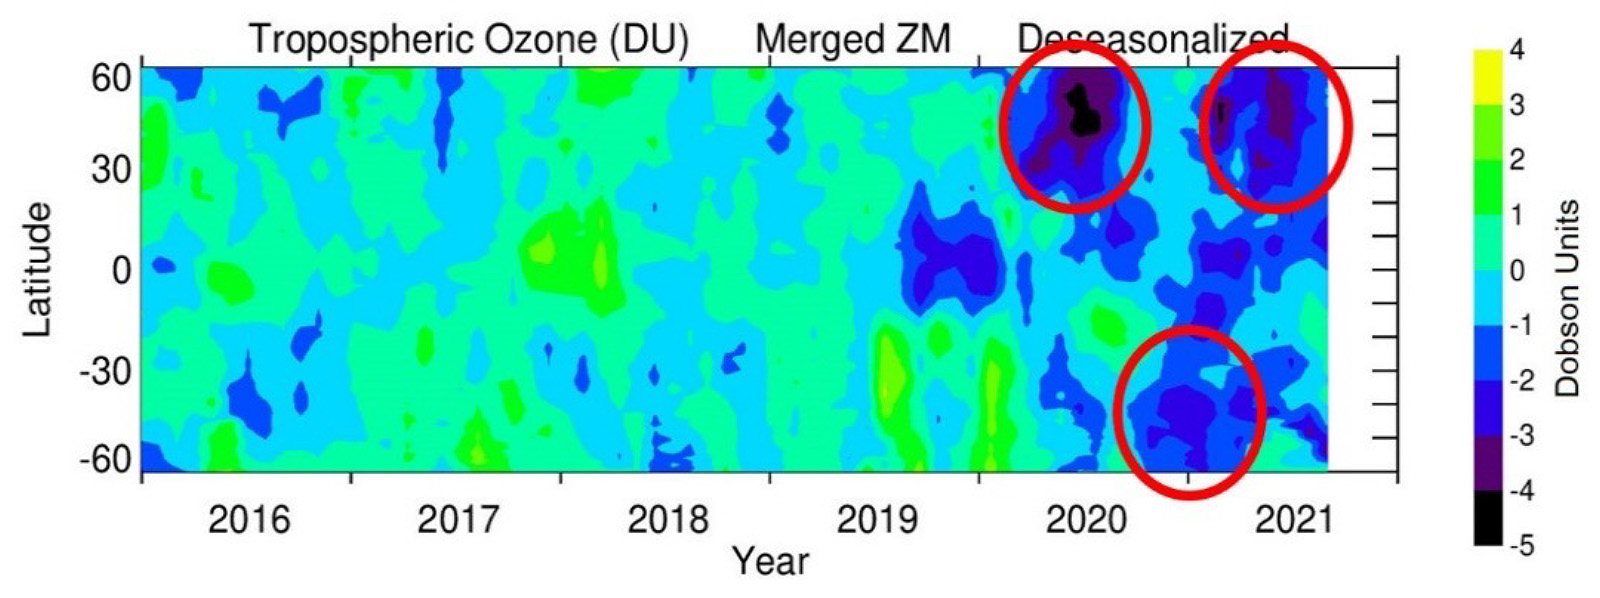
Figure 2: Inter-annual anomalies (based on 2016-2019 average) in zonal mean tropospheric column ozone (in Dobson Units) for January 2016-August 2021. Negative anomalies in the tropics in 2019 are not COVID-related, but instead caused by an exceptionally strong positive phase of the Indian–Ocean Dipole (IOD) that was the strongest on record since 2006).
Data Sources:
EPIC data are available via the NASA ASDC and local link from the NASA GSFC Code 614 homepage. OMPS is available locally via NASA GSFC Code 614. OMI data are available via NASA GSFC AVDC and locally from NASA GSFC Code 614. The merged satellite tropospheric column ozone used here is derived by statistical averaging of the original tropospheric column ozone from EPIC, OMPS, and OMI based on their individual daily coverage. Tropospheric column ozone is a residual measurement of satellite instrument total column ozone minus assimilated Microwave Limb Sounder (MLS) stratospheric column ozone from MERRA-2. MERRA-2 data can be found here.
Reference:
Ziemke, J. R., N. A. Kramarova, S. M. Frith, L.-K. Huang, D. P. Haffner, K. Wargan, L. N. Lamsal, G. J. Labow, R. D. McPeters, and P. K. Bhartia, NASA satellite measurements show global-scale reductions in tropospheric ozone in 2020 and again in 2021 during COVID-19, Geophys. Res. Lett., 49, https://doi.org/10.1029/2022GL098712, 2022.
09.2022

