Because India has the sixth largest economy and the second largest population of any country, it also has one of the largest increases in mortality rates due to chronic exposure to elevated levels of surface ozone and particulate matter. We interpret spatial and temporal variations in HCHO column distributions over India observed by the Aura Ozone Monitoring Instrument (OMI) and find that HCHO has biogenic, pyrogenic, and anthropogenic sources. We also found that on a continental scale much of the seasonal cycle in observed HCHO columns can be explained by monthly variations in surface temperature. One source for HCHO over India includes biomass burning, which makes a significant contribution to observed columns during March and April over northeastern India.
Our ability to interpret HCHO sources will be improved by the launch of TROPOMI aboard Sentinel-5P, which will result in daily maps of HCHO columns at a spatial resolution of 7 km with increased clear-sky scenes available. Currently, Aura overpasses once per day in the early afternoon, giving only a "snapshot" of HCHO levels.
The upcoming NASATEMPO mission, which will be in geosynchronous orbit, will allow the hourly evolution of HCHO emissions to be studied.
Technical Description of Figures:
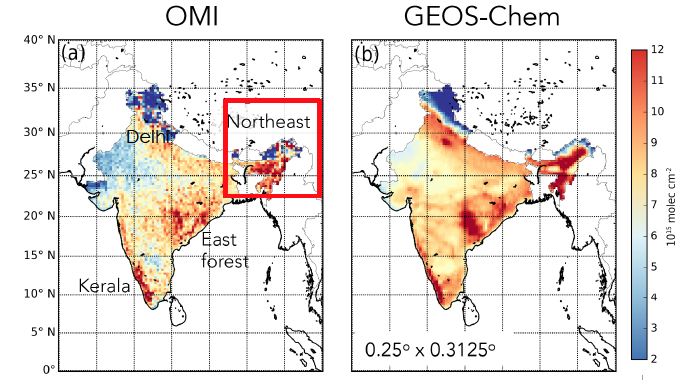
Map (top left) shows annual mean clear-sky OMI HCHO vertical column density (VCD) for 2014 with GEOS-Chem HCHO VCD sampled at the time and location of each observed scene at 0.25° x 0.3125°spatial resolution over India.
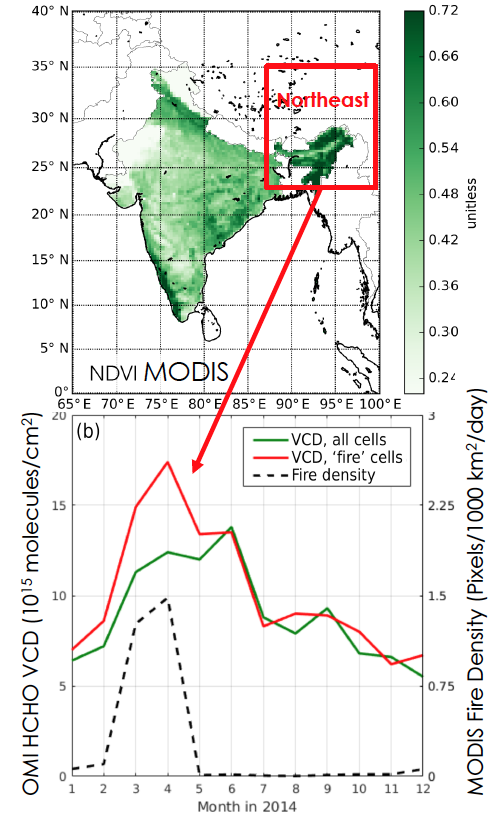
Annual mean values of the Normalized Difference Vegetation Index (NDVI) for 2014 from the NASA MODIS instrument (top right), averaged on the 0.25° x 0.3125° GEOS- Chem nested grid shows forested regions in southwest, east, and northeast India. Corresponding time series of monthly mean HCHO columns (1015 molec.cm-2) and the number of MODIS fire detections (103 km2 day-1) over northeastern India. The green line denotes all HCHO columns over the region and the red line denotes columns that are most affected by fires as indicated by MODIS fire counts.
Data Sources:
Aura Ozone Monitoring Instrument (OMI) version 3 level 2 formaldehyde (HCHO) slant column densities (SCDs) from the NASA Data and Information Services Center were used in this study. With the OMI (OMCLD02) cloud data product and the nested v10-01 GEOS-Chem model data , driven by GEOS-FP analysed meteorological fields provided by the Global Modeling and Assimilation Office (GMAO) at NASA Goddard Space Flight Center, vertical column densities (VCDs) were calculated on the nested 0.25° (latitude) x 0.3125°(longitude) GEOS-Chem grid. To estimate the time-dependent production of HCHO in forest and urban photochemical environments, v3.0 CAABA/MECCA (0-D) box model data (archived at the Edinburgh Data Share) were used in this study. The MEGAN v2.1 emission model (Model of Emissions of Gases and Aerosols from Nature) provided information on biogenic emissions, such as isoprene. Monthly pyrogenic emissions were taken from the Global Fire Emissions Database (GFED) version 4. Annual mean values of the Normalized Difference Vegetation Index (NDVI) and the active fires product for 2014 were from the NASA Moderate Resolution Imaging Spectroradiometer (MODIS) instrument, averaged on the 0.25° x 0.3125° GEOS-Chem nested grid.
References: Surl, L., Palmer, P. I., and González Abad, G.: Which processes drive observed variations of HCHO columns over India?, Atmos. Chem. Phys., 18, 4549-4566, https://doi.org/10.5194/acp-18-4549-2018, 2018.
4.23.2018

