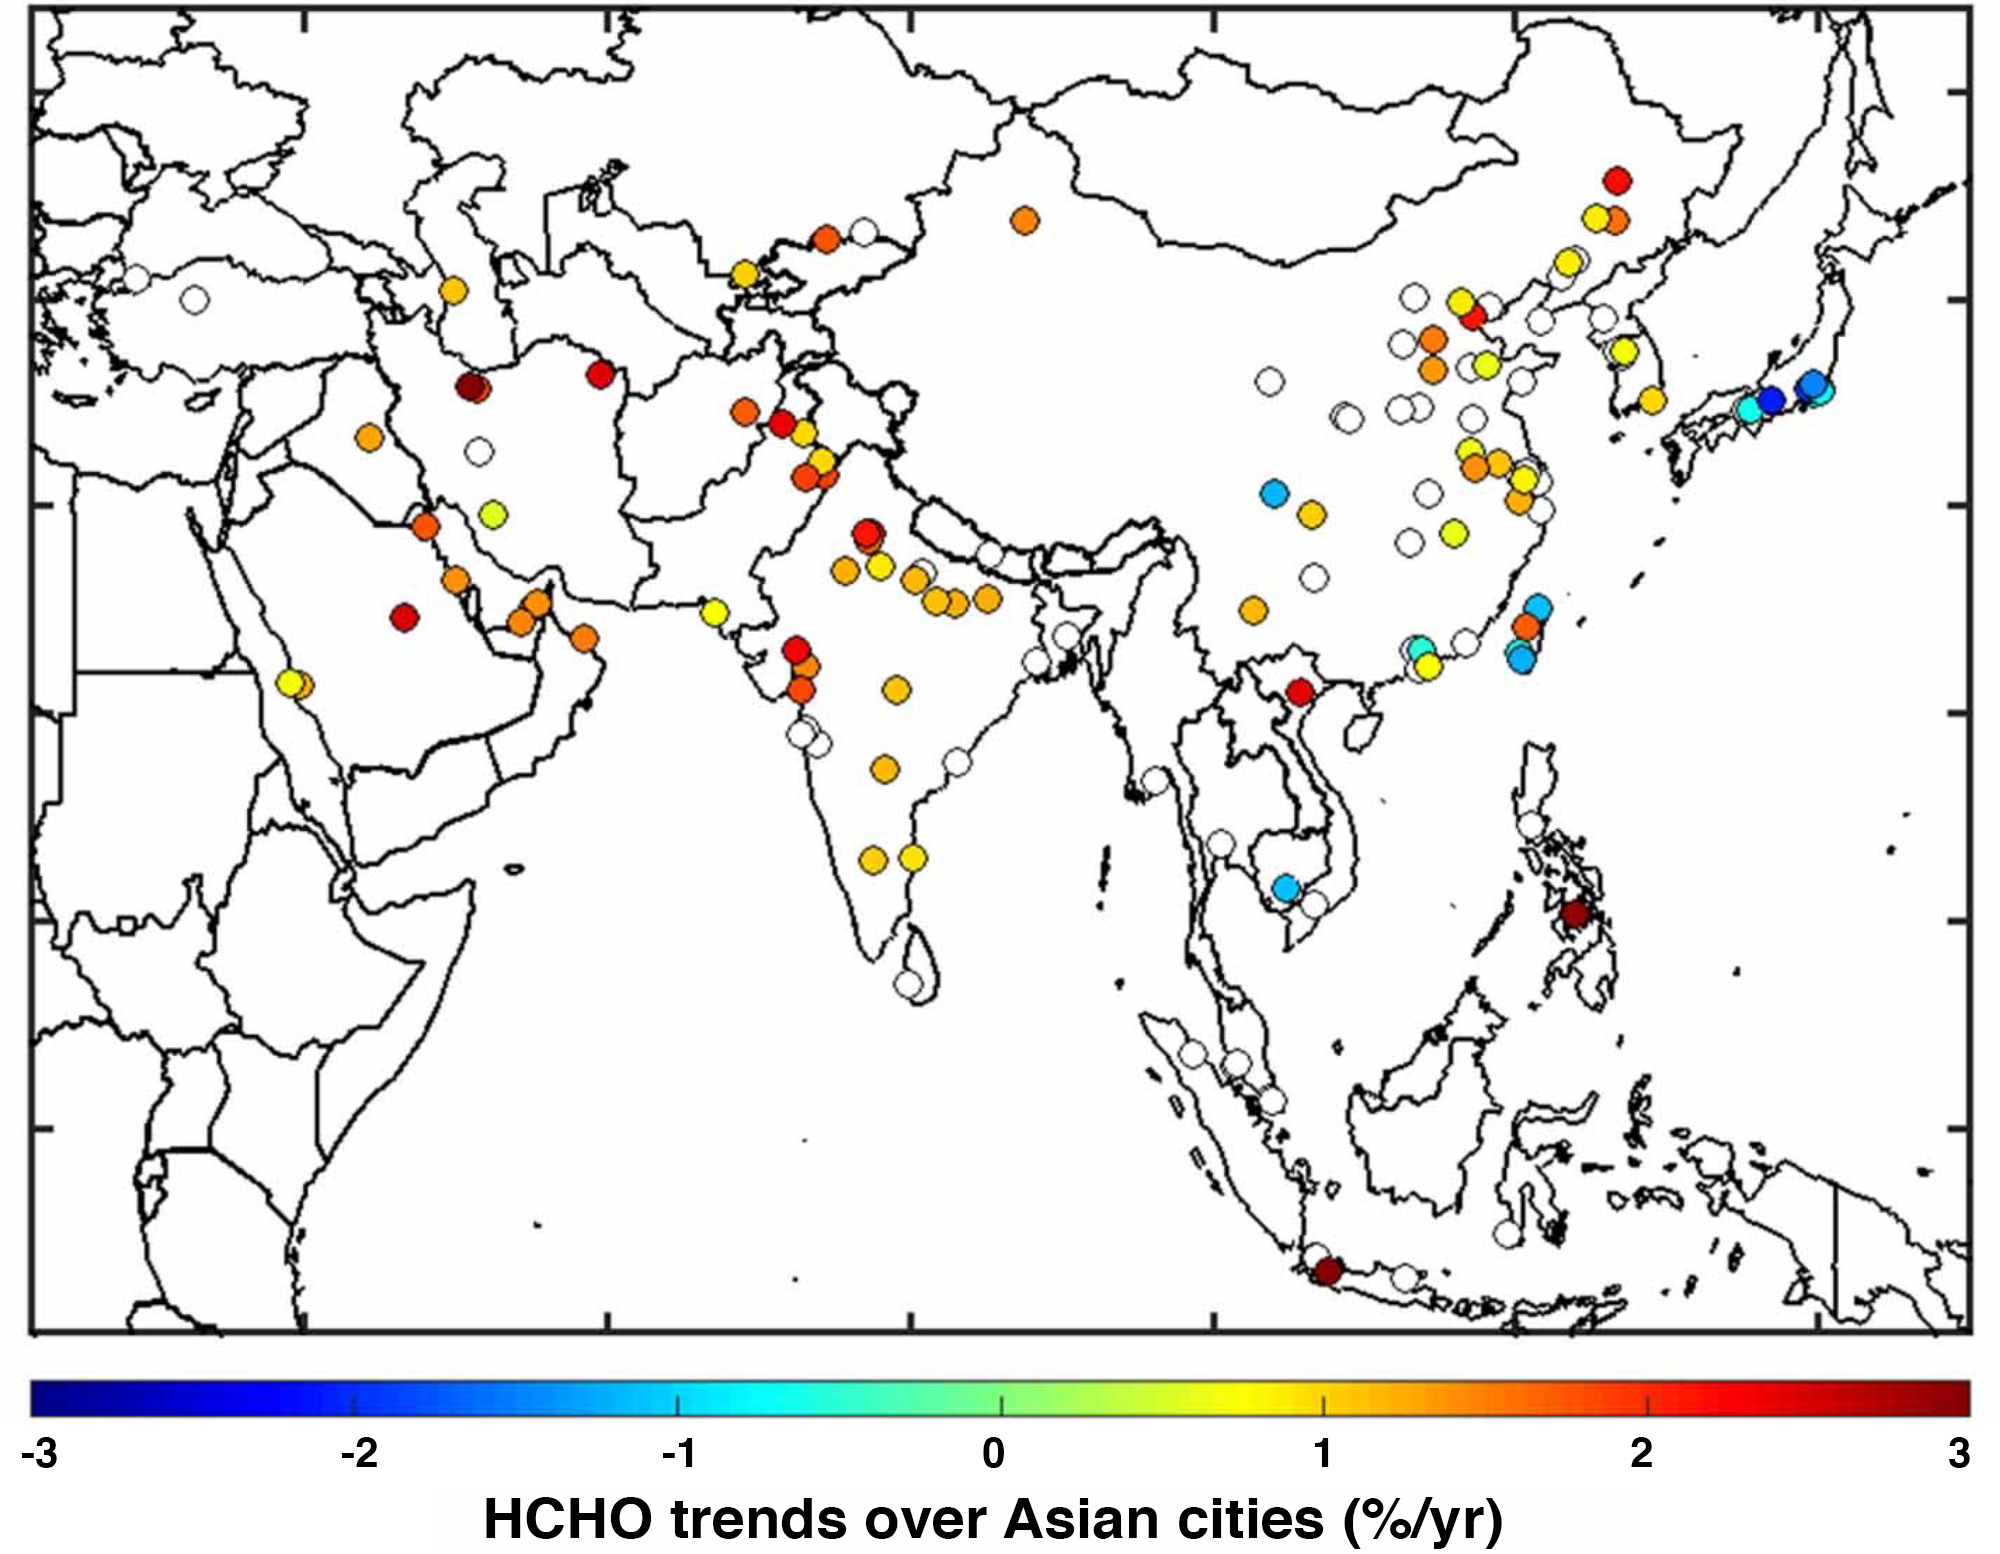
Temperature-corrected HCHO trends (in % yr−1) over the Asian cities considered in this study. Colored circles denote cities for which significant trends are detected, white circles denote cities with no significant trends.
Contributions due to anthropogenic emissions are isolated by applying a correction based on near-surface temperature in order to account for interference from local biogenic emissions.
Strong positive trends are derived over the Middle East and the Indian subcontinent (up to 3.6% yr−1 and 2.4% yr−1 respectively) where regulations of anthropogenic non-methane volatile organic compound (NMVOC) emissions are currently limited.
Weaker trends are observed over cities located in China, where the air pollution action plan (2013) may have mitigated NMVOC trends early on, but targeted legislature concerning VOC emissions was only recently introduced.
HCHO trends for cities located in South and Equatorial Asia are mostly not significant or very uncertain.
Cities located in Taiwan and Japan (regions in Asia where legislation has been in place since the early 2000s) display mostly negative trends.
Technical Description of Figure(s):
Temperature-corrected HCHO trends (in % yr−1) over the Asian cities considered in this study. Colored circles denote cities for which significant trends are detected, white circles denote cities with no significant trends.
Scientific significance, societal relevance, and relationships to future missions:
Aura OMI trends of formaldehyde (HCHO) linked to anthropogenic activity over large cities located in the Asian continent are calculated for the period 2005–2019 using the Quality Assurance for Essential Climate Variables. Contributions due to anthropogenic emissions are isolated by applying a correction based on near-surface temperature in order to account for interference from local biogenic emissions. Strong positive trends are derived over the Middle East and the Indian subcontinent (up to 3.6% yr−1 and 2.4% yr−1 respectively) where regulations of anthropogenic non-methane volatile organic compound (NMVOC) emissions are currently limited. Weaker trends are observed over cities located in China, where the air pollution action plan (2013) may have mitigated NMVOC trends early on, but targeted legislature concerning VOC emissions was only recently introduced. HCHO trends for cities located in South and Equatorial Asia are mostly not significant or very uncertain. Cities located in Taiwan and Japan (regions in Asia where legislation has been in place since the early 2000s) display mostly negative trends.
Data Availability:
The data that support the findings of this study are openly available at the following URL/DOI: http://doi.org/10.18758/71021031 and http://doi.org/10.21944/qa4ecv-no2-omi-v1.1. We use HCHO and NO2 data retrieved from the OMI nadir-viewing instrument, both developed in the framework of the EU FP7 project Quality Assurance for Essential Climate Variables (Boersma et al 2017, De Smedt et al 2018) for the period 2005 to the present. OMI follows a sun-synchronous, low-Earth orbit with an Equator local overpass time of ca. 13:45 and has a resolution of 13 × 24 km2 at nadir (Levelt et al 2006). The HCHO data set is based on the differential optical absorption spectroscopy algorithm described in De Smedt et al (2018). Here we use observations with cloud fractions lower than 20% in order to minimize potential effects from clouds. The NO2 data set is based on revised spectral fitting features, accounting for improved absorption cross sections, instrument calibration, and surface effects (Boersma et al 2018, Zara et al 2018). The data are processed according to the data quality recommendations with a cloud filter set at 40%. For monthly mean OMI HCHO and NO2 column data, the detection limit is estimated at 2.5 × 10¹⁵ molec cm −2 (De Smedt et al 2021) and at 1.0 × 10¹⁵ molec cm −2 (Compernolle et al 2020), respectively. The satellite products were recently validated against MAX-DOAS (Multiple AXis-Differential Optical Absorption Spectroscopy) ground-based observations (Wang et al 2019, Compernolle et al 2020, De Smedt et al 2021).
References:
M Bauwens, B Verreyken, T Stavrakou, J-F Müller and I De Smedt (2022). Spaceborne evidence for significant anthropogenic VOC trends in Asian cities over 2005–2019. Environmental Research Letters, Volume 17, Number 1. https://doi.org/10.1088/1748-9326/ac46eb
03.2022

