Here we show a significant slowdown in decreasing US emissions of nitrogen oxides (NOx) and carbon monoxide (CO) for 2011–2015 using satellite and surface measurements. This observed slowdown in emission reductions is significantly different from the trend expected using US Environmental Protection Agency (EPA) bottom-up inventories and impedes compliance with local and federal agency air-quality goals.
We find that the difference between observations and EPA’s NOx emission estimates could be explained by: (1) growing relative contributions of industrial, area, and off-road sources, (2) decreasing relative contributions of on-road gasoline, and (3) slower than expected decreases in on-road diesel emissions.
Based on their estimates, EPA expected a gradual decline of total NOx emissions from 2005 to 2015. (black lines in figure at right)
However, EPA air quality monitors (AQS) and OMI data products (NASA, DOMINO, & BEHR: sampled at AQS monitors) show a consistent slowdown of rate of decrease in NO2 over US cities from 2010 on.
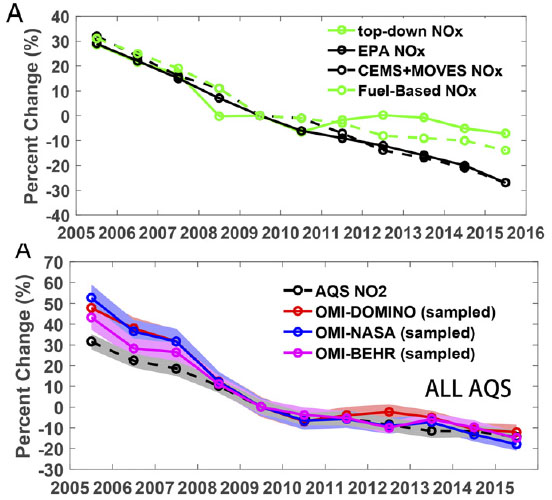
Top : Percent changes (normalized at 2009) of top-down US anthropogenic NOx emission estimates from inverse analysis (green line), EPA’s emissions trends report data of NOx (black solid line), revised EPA emission estimates including CEMS and MOVES national-scale data (black dashed line), and revised industrial, on-road, off-road emission estimates using fuel-based methodologies (green dashed line).
Bottom : Percent changes (annual means normalized at 2009) of AQS surface in situ NO2 measurements and tropospheric OMI NNO2 columns for various regions. Both AQS and OMI measurements are averaged with monthly resolution; the averaged OMI (monthly) data are sampled at AQS NO2 (monthly) measurement locations and times; annual means are calculated based on monthly means. The shaded areas represent 1-σ uncertainties for random and sampling errors.
Data Sources:
“Top-down anthropogenic NOx” comes from the inverse modeling study of Miyazaki et al. (2017). “EPA NOx” is Air Pollutant Emissions Trends Data downloaded at: https://www.epa.gov/air-emissions-inventories/air-pollutant-emissions-trends-data. “CEMS+MOVES” is EPA trends data, but using CEMS and MOVES for egu & transport, respectively. “Fuel-Based NOx” is this study’s bottom-up estimate (on-road and off-road engines) based on Xing et al. (2013). Satellite data includes: TropNO2 from OMI NASA, DOMINO, & BEHR retrievals (https://disc.sci.gsfc.nasa.gov, www.temis.nl, and http://behr.cchem.berkeley.edu/DownloadBEHRData.aspx respectively). Daily-averaged in-situ surface NO2 measurements from the EPA AQS network (http://aqsdr1.epa.gov/aqsweb/aqstmp/airdata/download_files.html#Daily) were averaged to obtain monthly mean concentrations at each station for comparison to the satellite products.
Scientific significance, societal relevance, and relationships to future missions:
Emissions of nitrogen oxides (NOx) have a large impact on air quality and climate change as precursors in the formation of ozone and secondary aerosols. We find that NOx emissions have not been decreasing as expected in recent years (2011– 2015) when comparing top-down estimates from satellites and surface nitrogen dioxide (NO2) measurements to the trends predicted from the US Environmental Protection Agency’s emission inventory data. This work highlights the importance of satellite and model inversion technologies to monitor changes in pollutant emissions and interpret the effects of regulations and economic activities as well as evaluate the EPA’s current emission inventory. Going forward, satellite data products from TROPOMI and TEMPO will have the higher temporal and spatial resolutions needed to identify causes for regional variability in trends, especially for regions with different air-quality management practices.
References: Zhe Jiang, Brian C. McDonald, Helen Worden, John R. Worden, Kazuyuki Miyazaki, Zhen Qu, Daven K. Henze, Dylan B. A. Jones, Avelino F. Arellano, Emily V. Fischer, Liye Zhu, and K. Folkert Boersma (2018), Unexpected slowdown of US pollutant emission reduction in the past decade, PNAS, 115 (20), 5099-5104, https://doi.org/10.1073/pnas.1801191115.
8.2018

