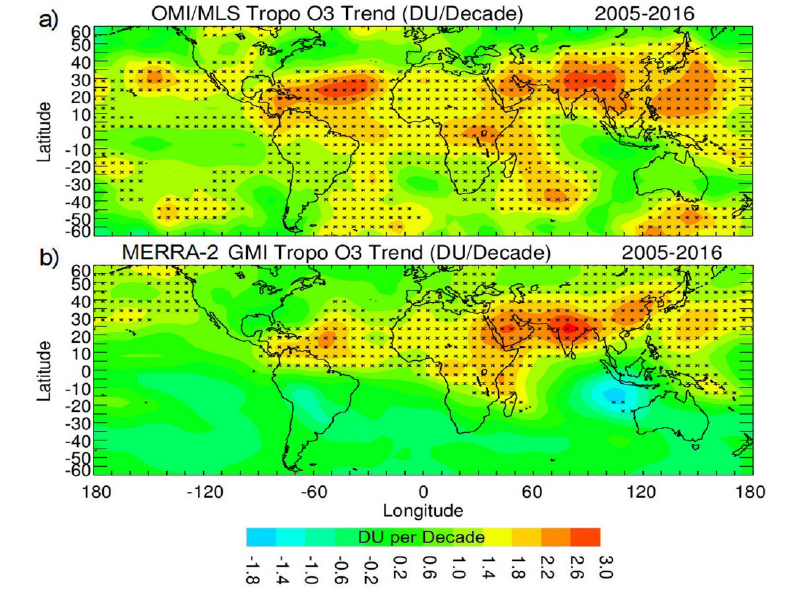
 (a) Trends in OMI/MLS tropospheric column ozone (TCO) in DU-decade-1 for 2005-2016. Asterisks denote grid points where trends are statistically significant at the 2σ level. (b) Same as (a) except for MERRA-2 GMI simulated TCO.
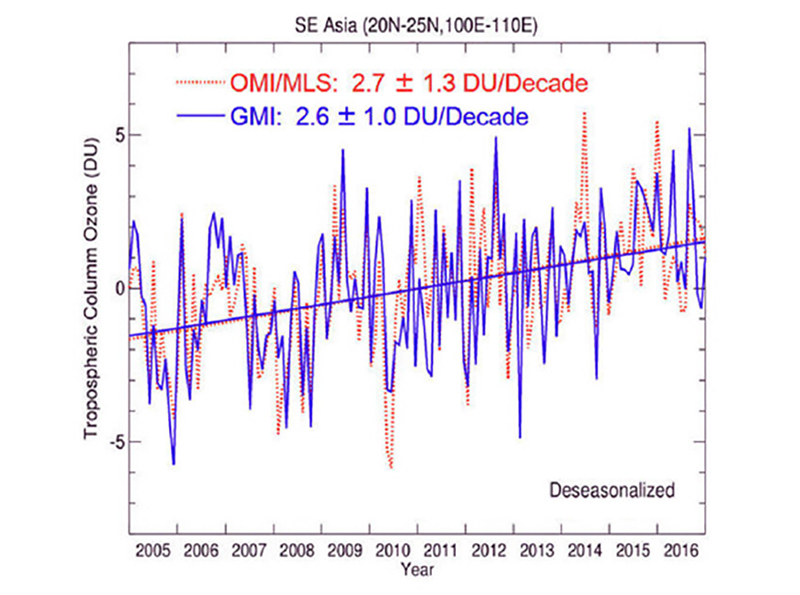 Deseasonalized TCO for OMI/MLS (red, dashed curve) and the MERRA-2 GMI model (blue, solid curve) for SE Asia. Included are MLR regression fits for linear trends and calculated 2σ values (both in DU-decade-1).
Past studies suggest that ozone in the troposphere has increased globally throughout much of the 20th century due to increases in anthropogenic emissions and transport. We show by combining satellite measurements with a chemical transport model that during the last four decades tropospheric ozone does indeed indicate increases that are global in nature, yet still highly regional. Satellite ozone measurements from Nimbus-7 and Earth Probe Total Ozone Mapping Spectrometer (TOMS) are merged with ozone measurements from Aura Ozone Monitoring Instrument/Microwave Limb Sounder (OMI/MLS) to determine trends in tropospheric ozone for 1979-2016. Both TOMS (1979-2005) and OMI/MLS (2005-2016) depict large increases in tropospheric ozone from the Near East to India/East Asia and further eastward over the Pacific Ocean. The 38-year merged satellite record shows total net change over this region of about +6 to +7 Dobson Units (DU) (i.e., ~15-20% of average background ozone), with the largest increase (~4 DU) occurring during the 2005-2016 Aura period.
The Global Modeling Initiative (GMI) chemical transport model with time-varying emissions is included to evaluate tropospheric ozone trends for 1980-2016. The GMI simulation for the combined record also depicts greatest increases of +6 to +7 DU over India/east Asia, identical to the satellite measurements. In regions of significant increases in TCO the trends are a factor of 2-2.5 larger for the Aura record when compared to the earlier TOMS record; for India/east Asia the trends in TCO for both GMI and satellite measurements are ~+3 DU-decade-1 or greater during 2005-2016 compared to about +1.2 to +1.4 DU-decade-1 for 1979-2016. The GMI simulation and satellite data also reveal a tropospheric ozone increase of ~+4 to +5 DU for the 38-year record over central Africa and the tropical Atlantic Ocean. Both the GMI simulation and satellite-measured tropospheric ozone during the latter Aura time period show increases of ~+3 DU-decade-1 over the NH Atlantic and NE Pacific.
OMI tropospheric ozone is derived by combining Aura Microwave Limb Sounder (MLS) ozone with both column ozone and cloud parameter measurements from the Aura Ozone Monitoring Instrument (OMI). The time period covered is October 2004 to present with spatial coverage from 60oS to 60oN. This data product is available and free for the public via NASA websites ftp://jwocky.gsfc.nasa.gov/ and https://avdc.gsfc.nasa.gov/.
References: Ziemke, J. R., L. D. Oman, S. A. Strode, A. R. Douglass, M. A. Olsen, R. D. McPeters, P. K. Bhartia, L. Froidevaux, G. J. Labow, J. C. Witte, A. M. Thompson, D. P. Haffner, N. A. Kramarova, S. M. Frith, L. K. Huang, G. R. Jaross, C. J. Seftor, M. T. Deland, and S. L. Taylor, Trends in global tropospheric ozone inferred from a composite record of TOMS/OMI/MLS/OMPS satellite measurements and the MERRA-2 GMI simulation, Atmos. Chem. Phys., 19, 3257-3269, https://doi.org/10.5194/acp-19-3257-2019, 2019.
6.2019

