Here we report a newly developed emission inventory, OMI-HTAP, by combining these OMI-based emission estimates and the conventional bottom-up inventory, HTAP, for smaller sources that OMI is not able to detect. OMI-HTAP includes emissions from OMI-detected sources that are not captured in previous leading bottom-up inventories, enabling more accurate emission estimates for regions with such missing sources. In addition, our approach offers the possibility of rapid updates to emissions from large point sources that can be detected by satellites.
Improved model performance with the new SO2 emissions estimates in the OMI-HTAP inventory
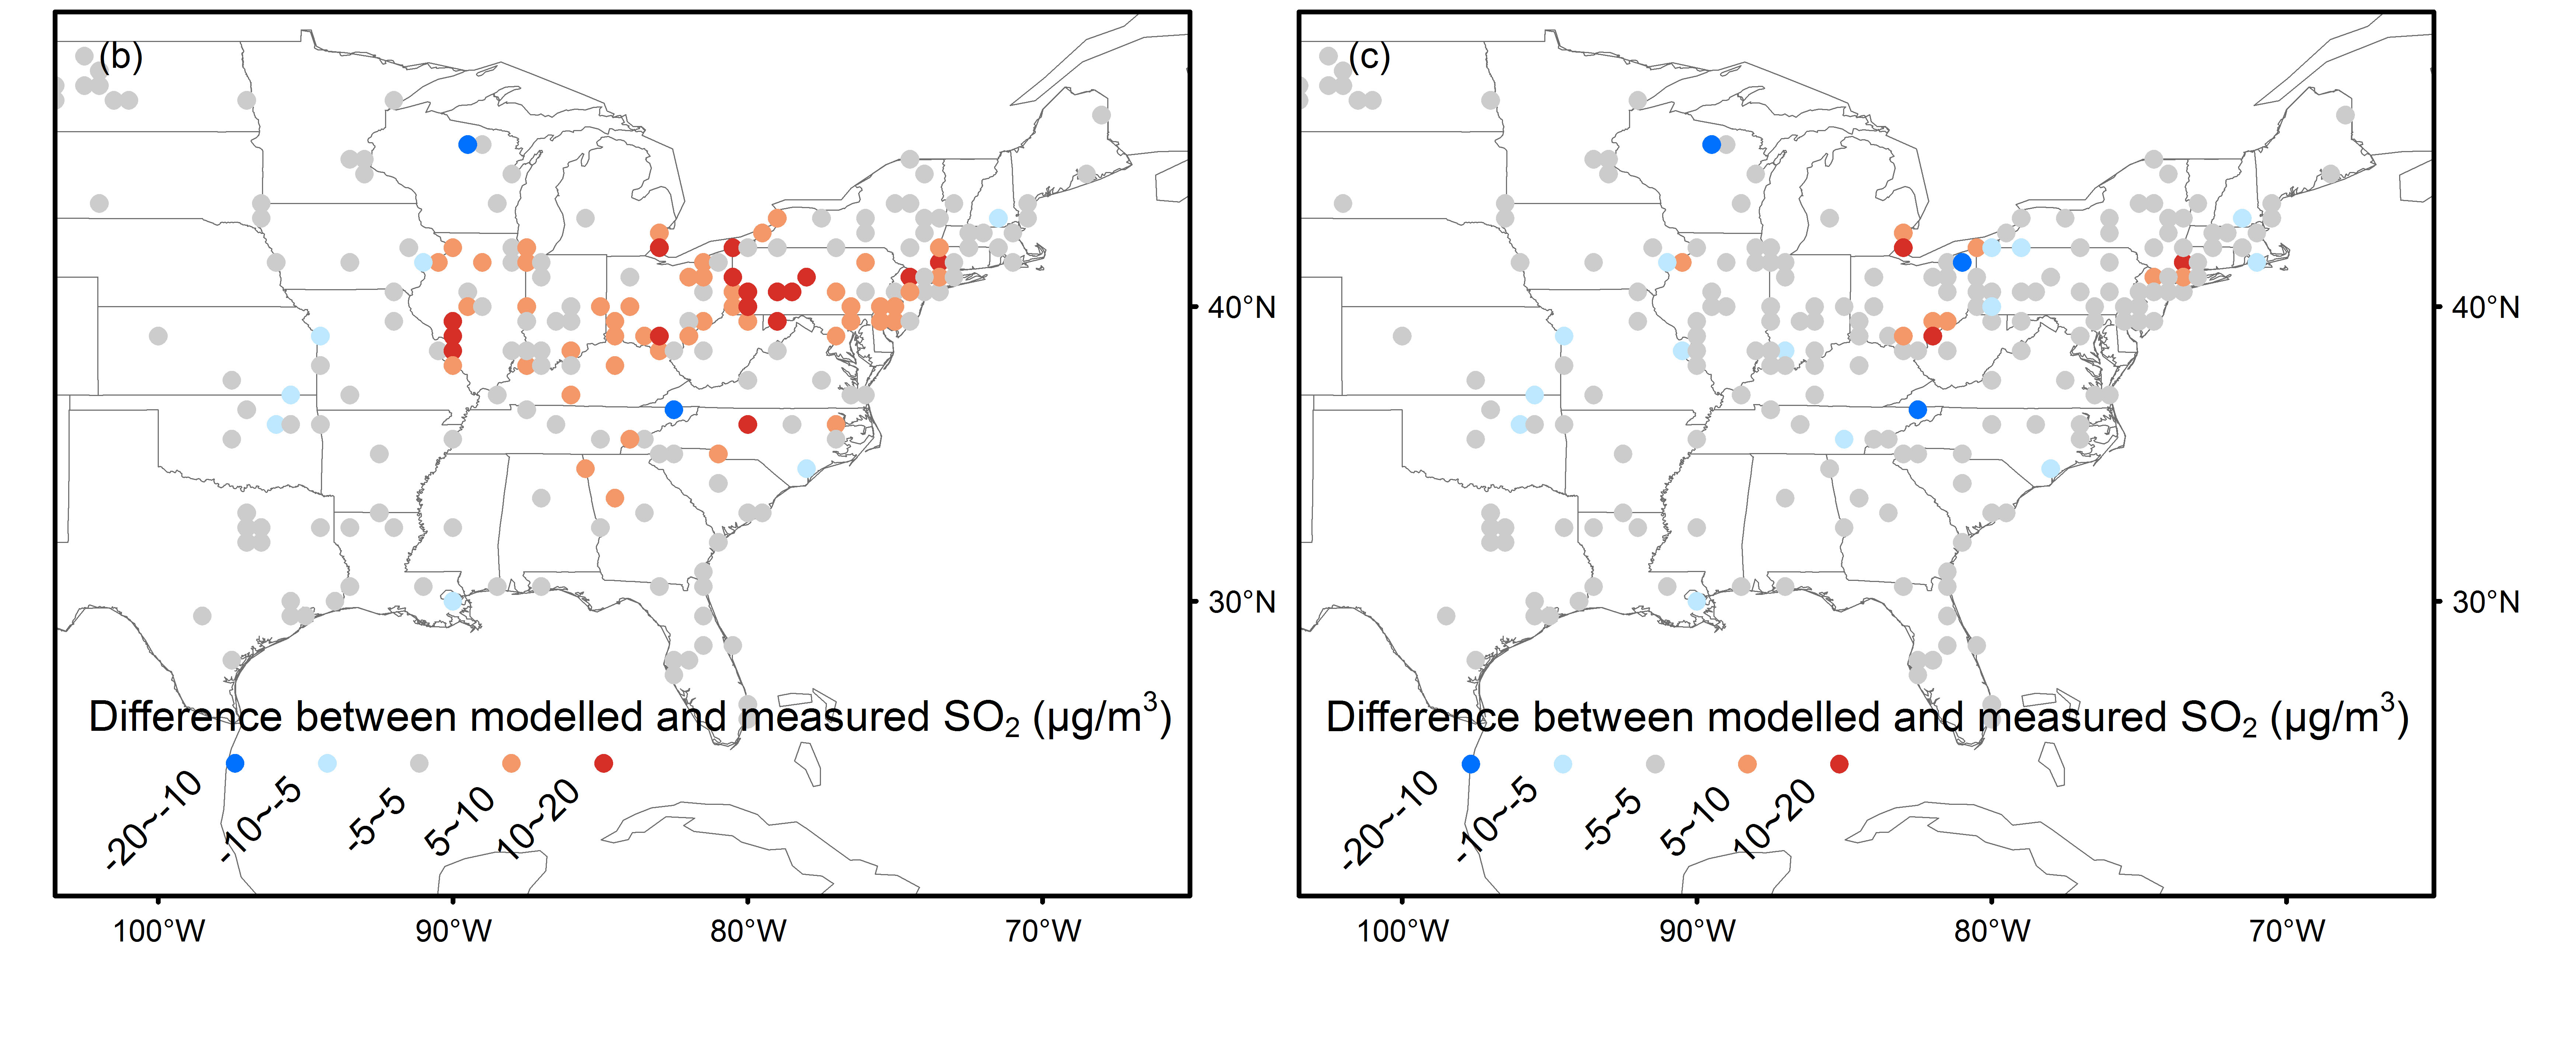
The differences of annual averaged SO2surface concentrations between in-situ measurements and the modeled d SO2using the bottom-up inventory HTAP (left) and our new OMI-HTAP inventory (right).
Our methodology applied to OMI-HTAP can also be used to merge improved satellite-derived estimates with other multi-year bottom-up inventories, which may further improve the accuracy of the emission trends. OMI-HTAP SO2 emissions estimates for Persian Gulf, Mexico, and Russia are 59 %, 65 %, and 56 % larger than HTAP estimates in 2010, respectively. We have evaluated the OMI-HTAP inventory by performing simulations with the Goddard Earth Observing System version 5 (GEOS-5) model. The GEOS-5 simulated SO2 concentrations driven by both HTAP and OMI-HTAP were compared against in situ measurements.
We focus on the validation for 2010 for which HTAP is most valid and for which a relatively large number of in situ measurements are available. Results show that the OMI-HTAP inventory improves the agreement between the model and observations, in particular over the US, with the normalized mean bias decreasing from 0.41 (HTAP) to −0.03 (OMI- HTAP) for 2010. Simulations with the OMI-HTAP inventory capture the worldwide major trends of large anthropogenic SO2 emissions that are observed with OMI. Correlation coefficients of the observed and modeled surface SO2 in 2014 increase from 0.16 (HTAP) to 0.59 (OMI-HTAP) and the normalized mean bias dropped from 0.29 (HTAP) to 0.05 (OMI- HTAP), when we updated 2010 HTAP emissions with 2014 OMI-HTAP emissions in the model.
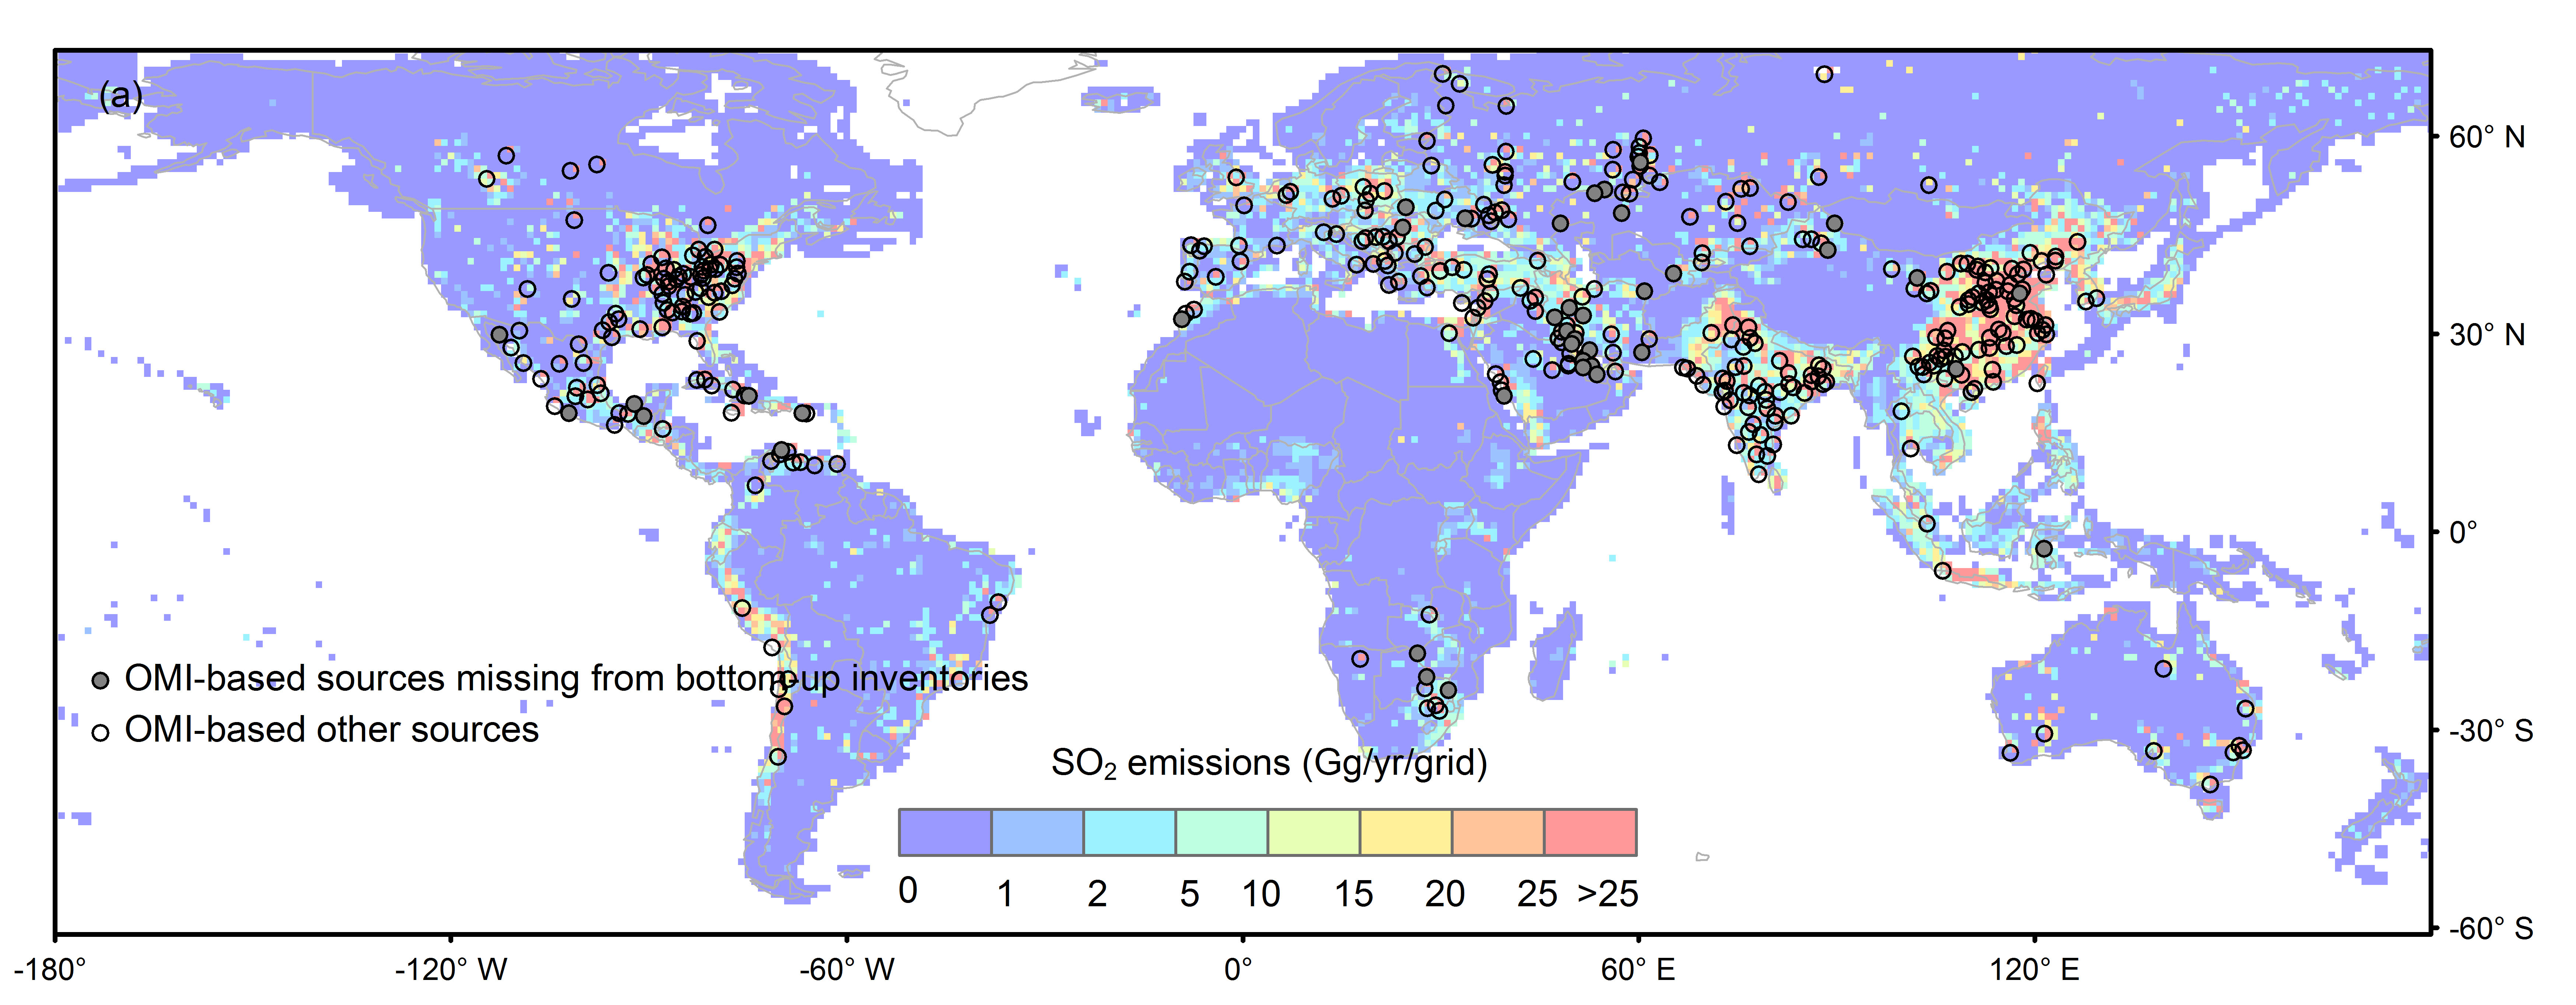
OMI-HTAP is novel in that it is the first inventory with inclusion of nearly 400 OMI-detected sources that are not captured in previous leading bottom-up inventories. It enables more accurate emission estimates for regions with missing sources (e.g., the Middle East and Mexico). OMI-HTAP provides dynamic emissions since 2005, allowing for updates to the emissions over time. OMI-HTAP with accurate location information of each large point source contributes to correction of the mis-located emissions in bottom-up inventories. The accuracy of the inventory can be substantially improved in the future using observations from recently launched TROPOspheric Monitoring Instrument (TROPOMI), featuring even higher spatial resolution than OMI. More accurate estimates for diurnally and seasonally varying emissions can be expected using the upcoming geostationary satellite instruments, such as TEMPO.
Satellite-derived emission estimates are based on SO2 measurements from the Aura Ozone Monitoring Instrument (OMI). The OMI-based emission catalogue of nearly 500 sources from Fioletov et al. (2016) is used to develop a new global SO2 emission database. The OMI-based emission catalogue is based on version 1.3 level 2 (orbital level) OMI planetary boundary layer (PBL) SO2 products retrieved with the principle component algorithm (PCA) algorithm and updated air mass factors. The location of the source is derived by comparing the difference between the average downwind and average upwind SO2 column. The OMI-HTAP inventory provides monthly gridded SO2 emissions with global coverage at a spatial resolution of 0.1° × 0.1°. OMI-HTAP is available for 2005 to 2017. The state-of-the-art global anthropogenic emission inventory developed by the Task Force Hemispheric Transport Air Pollution (HTAP v2.2) was used for sources that satellites are unable to detect. The NASA Global Modeling and Assimilation Office (GMAO) Goddard Earth Observing System version 5 data assimilation system (GEOS-5 DAS) simulated global surface SO2 in this study with the HTAP and OMI-HTAP inventories. Modeled surface concentrations of SO2 were evaluated over the US, Europe and East Asia for the 2006, 2010, and 2014 using in situ measurements from air quality networks. We use stations from the US EPA Air Quality System (AQS), the European air quality database (Air-Base) for Europe, and the Acid Deposition Monitoring Network in East Asia (EANET) for East and Southeast Asia.
References: Liu, F., Choi, S., Li, C., Fioletov, V. E., McLinden, C. A., Joiner, J., Krotkov, N. A., Bian, H., Janssens-Maenhout, G., Darmenov, A. S., and da Silva, A. M.: A new global anthropogenic SO2 emission inventory for the last decade: a mosaic of satellite-derived and bottom-up emissions, Atmos. Chem. Phys., 18, 16571-16586, https://doi.org/10.5194/acp-18-16571-2018, 2018.
11.2018

