On March 24, 2020, Prime Minister Modi ordered a nationwide stay-at-home order for India’s 1.3 billion citizens in an attempt to slow the spread of COVID-19. As a consequence, less fossil fuels are being consumed and, subsequently, less air pollution is being emitted in India and also in neighboring countries, including Pakistan, Nepal, Bangladesh, and Sri Lanka.
The images show OMI data of Sulfur Dioxide (SO2) and Nitrogen Dioxide (NO2) over South Asia as an average of March 25 – April 25. The top images show the means of the period in previous years, while the bottom images show the means for 2020.
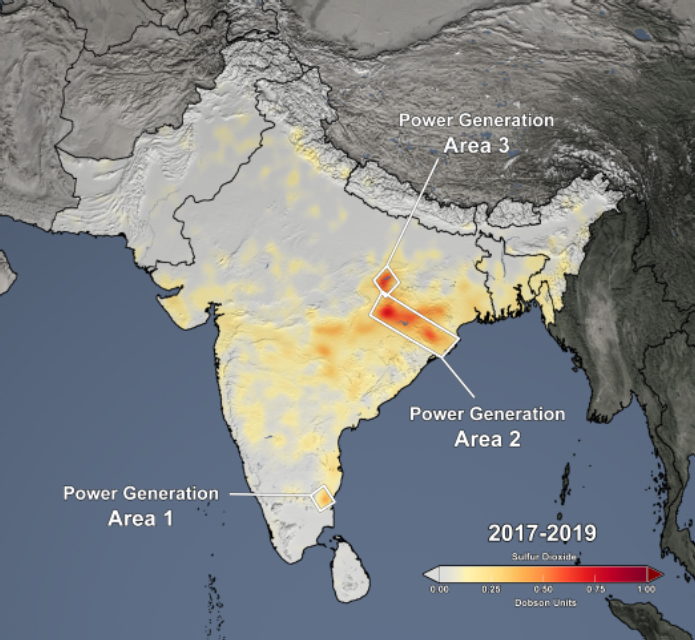
OMI SO2 : 2017-2019

OMI SO2 : 2020
The highest SO2 levels are over eastern India and primarily associated with electricity generation; the coal burned has sulfur impurities. Independent estimates indicate that electricity generation for India was down about 10% and 25% in March and April 2020, respectively, as compared to March and April 2019. One exception is in southern India which could be related to increased thermal power generation that came on line before the stay-at-home order. However, there was not a similar increase in NO2, so possibly coal with higher sulfur content was used in 2020 relative to 2019 without a significant increase in coal consumed.
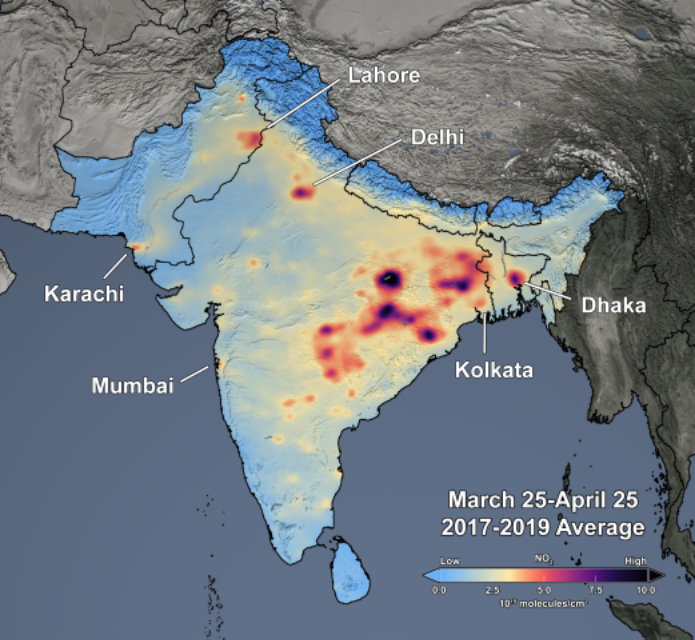
OMI NO2 : 2017-2019
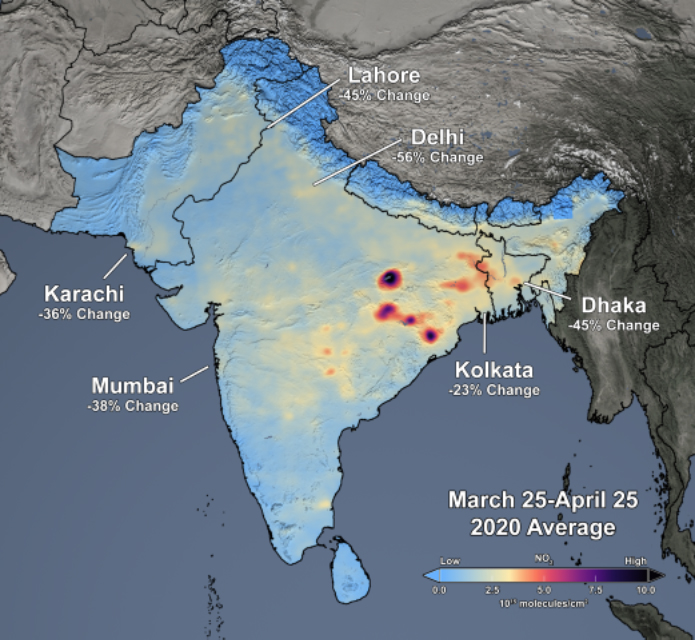
OMI NO2 : 2020
NO2 is primarily emitted from fossil fuel use. The images show that widespread decreases (~30-60%) in NO2 levels have occurred over most of South Asia. The highest NO2 levels are in eastern India and are primarily associated with electricity generation.
Data Sources:
Satellite-derived emission estimates are based on SO2 and NO2 measurements from the Aura Ozone Monitoring Instrument (OMI). OMI is a Dutch–Finnish contribution to the NASA Aura mission.
Technical description of figures:
SO2: India recently became the world’s largest emitter of sulfur dioxide (SO2). The highest SO2 levels are over eastern India and are primarily associated with electricity generation. SO2 is emitted during electricity generation if the coal burned has sulfur impurities. Other major sources in India include the ceramics industry and metal smelting. The decrease in SO2 levels in 2020 mostly reflect decreased power generation, including because of the shuttering of businesses during India’s stay-at-home order. Independent estimates indicate that electricity generation for India was down about 10% and 25% in March and April 2020, respectively, as compared to March and April 2019.
NO2: NO2 is primarily emitted from burning fossil fuels (diesel, gasoline, coal). The images show that widespread decreases (~30-60%) in NO2 levels have occurred over most of South Asia. For instance NO2 levels decreased by about 45% in Lahore, Pakistan, 45% in Dhaka, and 55% in Delhi, India. The highest NO2 levels that remain in South Asia are located in eastern India and are primarily associated with electricity generation by thermal power plants.
References: Can Li, Lok Lamsal, Yasuko Yoshida, Joanna Joiner, Bryan Duncan + GSFC Aura OMI Team. The images are free and publicly-available and may be downloaded at https://airquality.gsfc.nasa.gov/.
7.2020

