Scientific significance: Better knowledge of nitrogen oxides (NOx = NO+NO2 ) emissions from lightning (LNOx) will improve confidence in the magnitude of production of ozone in the middle and upper troposphere, where the effect of ozone on radiative forcing maximizes. LNOx influences the hydroxyl radical (OH), which is the primary tropospheric oxidant that plays a major role in determining the lifetime of methane, another important climate gas.
Method: We estimate the production efficiency (PE) of lightning NOx (LNOx) using satellite data from the Aura Ozone Monitoring Instrument (OMI) and the ground-based World Wide Lightning Location Network (WWLLN) in three regions (Figure 1). Data were obtained over 5 boreal summers, 2007 – 2011, and comprise the largest number of mid-latitude convective events to date for estimating the LNOx PE with satellite NO2 and ground-based lightning measurements. The algorithm estimates freshly produced LNOx by subtracting a background of aged NOx estimated from the OMI dataset itself.
Results: We infer an average value of 180 ± 100 moles LNOx produced per lightning flash. We also show evidence of a dependence of PE on lightning flash rate and find an approximate empirical power function relating moles LNOx to flashes. PE decreases by an order of magnitude for a 2-order of magnitude increase in flash rate. This phenomenon has not been reported in previous satellite LNOx studies but is consistent with ground-based observations suggesting an inverse relationship between flash rate and size.
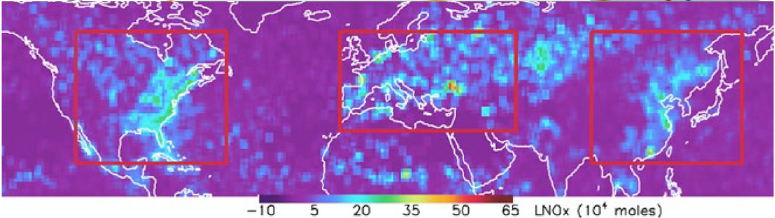
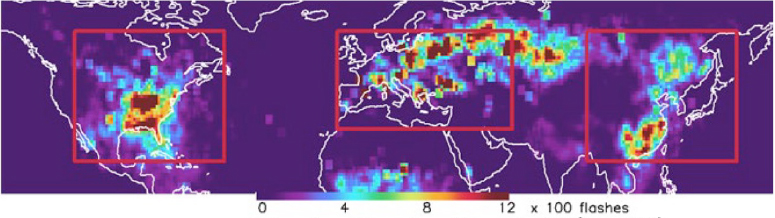
Mean daily data for JJA 2007 – 2011 per 1o longitude×1o latitude box, averaged over flashing boxes. (Top) LNOx (104 moles), (bottom) mean daily WWLLN 1-hour flash counts (x100). The red boxes outline the 3 geographic regions examined.
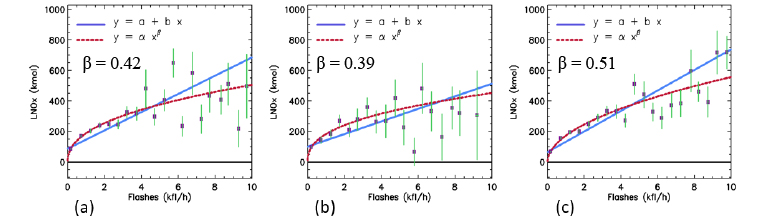
LNOx (103 moles) vs 1-hour flash rates (103 kiloflashes) using data binned by flash count for (a) N. America, (b) Europe and (c) E. Asia. Blue and red lines are linear and power-function fits to the data, respectively.
Summary:
Oxides of nitrogen are critical trace gases in the troposphere and are precursors for nitrate aerosol and ozone, which is an important pollutant and greenhouse gas. Lightning is the major source of NOx (NO + NO2 ) in the mid- to upper troposphere. We estimate the production efficiency (PE) of lightning NOx (LNOx) using satellite data from the Ozone Monitoring Instrument (OMI) and the ground-based World Wide Lightning Location Network (WWLLN) in three northern mid-latitude, primarily continental regions that include much of North America, Europe and East Asia. Data were obtained over 5 boreal summers, 2007 – 2011 and comprise the largest number of mid-latitude convective events to date for estimating the LNOx PE with satellite NO2 and ground-based lightning measurements. The algorithm estimates freshly produced LNOx by subtracting a background of aged NOx estimated from the OMI dataset itself. We infer an average value of 180 ± 100 moles LNOx produced per lightning flash. We also show evidence of a dependence of PE on lightning flash rate and find an approximate empirical power function relating moles LNOx to flashes. PE decreases by an order of magnitude for a 2-order of magnitude increase in flash rate. This phenomenon has not been reported in previous satellite LNOx studies but is consistent with ground-based observations suggesting an inverse relationship between flash rate and size.
Technical Description of Figures:
Scientific significance, societal relevance, and relationships to future missions:
Better knowledge of LNOx will improve confidence in the magnitude of production of ozone in the middle and upper troposphere, where the effect of ozone on radiative forcing of climate maximizes. LNOx also influences OH concentrations, which play a major role in determining the lifetime of methane. Methane is the second most important greenhouse gas and tropospheric ozone is the third most important.
Relevance for future science:
Increased accuracy of LNOx production will be obtained through use of TROPOMI NO2 columns and flashes from the Geostationary Lightning Mapper (GLM) onboard the GOES-16 and 17 satellites. This work is currently underway. Further refinement will be possible with the hourly NO2 column data expected from NASA TEMPO (geostationary) beginning in 2022.
Data sources:
References:
Bucsela, E., K. Pickering, D. Allen, R. Holzworth, N. Krotkov, (2019), Mid-latitude lightning NOx production efficiency inferred from OMI and WWLLN data, Journal of Geophysical Research – Atmospheres, https://doi.org/10.1029/2019JD030561.
Allen, D., K. Pickering, E. Bucsela, N. Krotkov, R. Holzworth, (2019), Lightning NOx production in the tropics as determined using OMI NO2 retrievals and WWLLN stroke data, Journal of Geophysical Research – Atmospheres, https://doi.org/10.1029/2018JD029824.
Pickering, K. E., E. Bucsela, D. Allen, A. Ring, R. Holzworth, and N. Krotkov (2016), Estimates of lightning NOx production based on OMI NO2 observations over the Gulf of Mexico, Journal of Geophysical Research - Atmospheres, 121, https://doi.org/10.1002/2015JD024179.
12.2019

