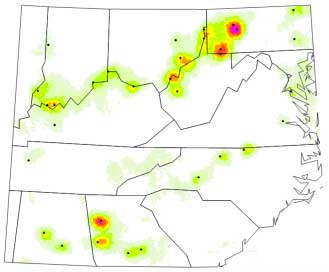
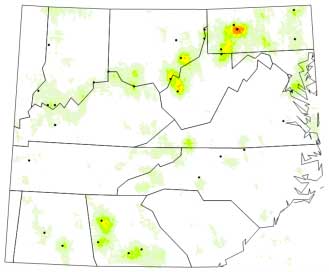

The figure shows average SO2 values measured by OMI on the NASA Aura spacecraft for the periods 2005-2007 and 2008-2010 over the Eastern US where the majority of large SO2 sources are located. Scientists use this information to identify anthropogenic sources of SO2 and to estimate their emission rates. The greatest values are in violet; the lowest in green. Yellow to violet colors correspond to statistically significant enhancements in SO2 pollution in the vicinity of the largest SO2 emitting coal-burning power plants indicated by the black dots.
Previous use of space-based SO2 retrievals has been limited to monitoring plumes from volcanic eruptions and detecting anthropogenic emissions from large source regions as in China. A new spatial filtration technique allows the detection of individual pollution sources in Canada and the US.
Credit : Fioletov, V., et al., (2011), Geophysical Research Letters, in press
10.21.2011

