Aura Science
Observations
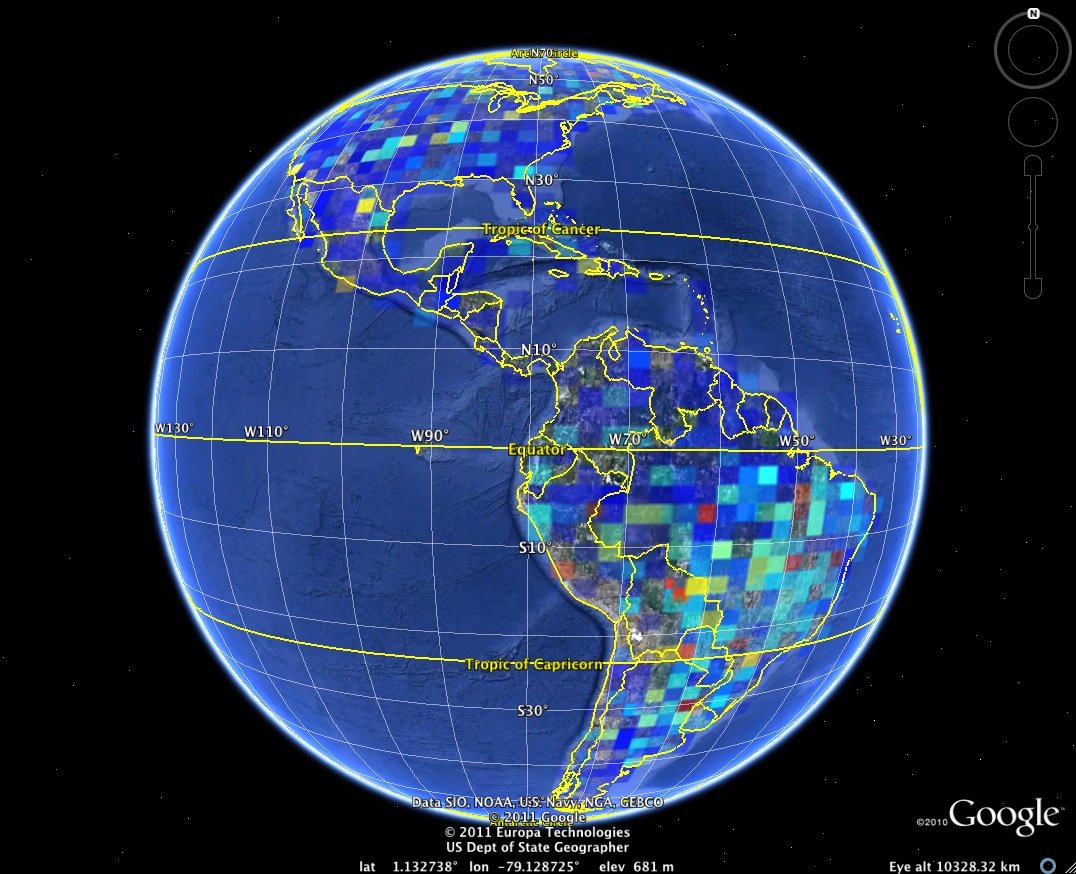
Ammonia from TES
The map shows TES ammonia (NH3) in October averaged over 2004-2009. High NH3 levels are visible over agricultural regions, such as the American Midwest and the Central Valley, as well as over areas with biomass burning in the southern hemisphere spring.
TES captures the variability of ammonia over the Earth's surface
April 2011

