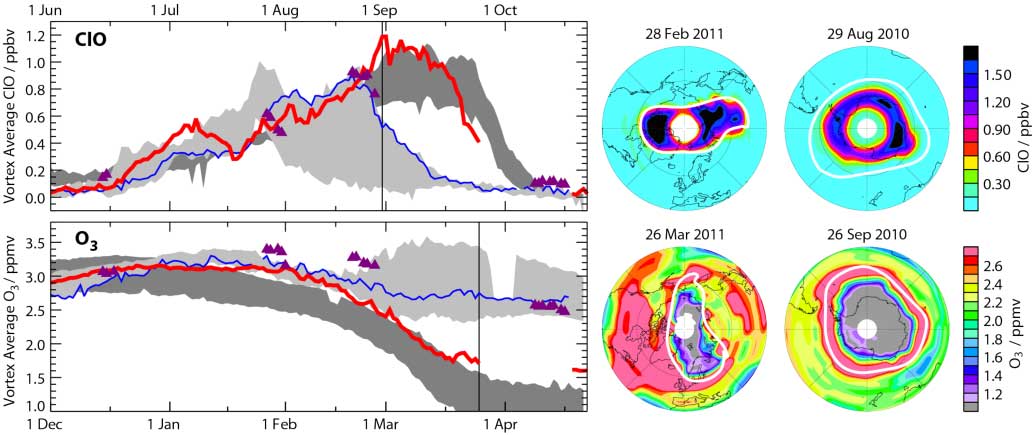
Aura Microwave Limb Sounder (MLS) observations of Arctic vortex average chlorine monoxide (ClO) and ozone (O3) at about 18km altitude in 2010/2011 (red) compared to 2004/2005 (blue), the 2004-2010 envelope (pale grey) and UARS MLS for 1996/1997 (purple triangles). Darker grey shading shows the comparable record for the Antarctic (shifted by six months, top axis). Maps compare selected days in the Arctic (left) to equivalent days in the Antarctic (right). White lines show the polar vortex (the region within which ozone destruction is confined).
Credit : Manney et al., Nature, 2011
09.30.2011