The response of tropospheric to lower stratospheric ozone to ENSO is derived using measurements from the Microwave Limb Sounder (MLS) and Tropospheric Emission Spectrometer (TES) onboard NASA's Aura satellite.
The ozone sensitivity to ENSO represents how ozone responds to a change in the Niño 3.4 Index, which in this case is for 1 K warming or El Niño. Tropospheric ozone is an important greenhouse gas and source of the hydroxyl radical which determines the oxidizing capacity of the troposphere.
Simulations using the Goddard Earth Observing System (GEOS) version 5 chemistry-climate model (CCM) forced with observed sea surface temperatures can largely reproduce this result.
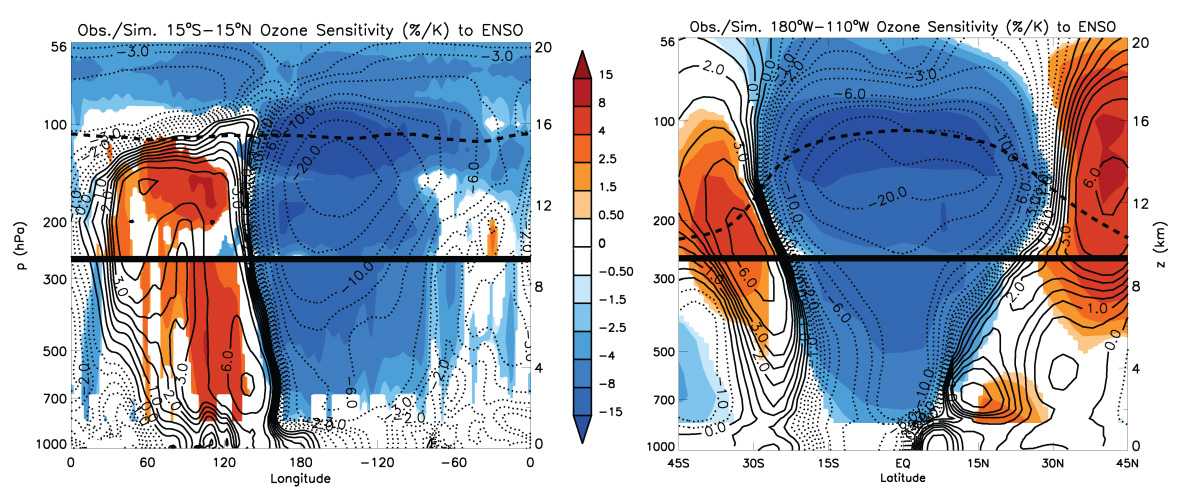
Left: Ozone sensitivity (%/K) to ENSO over the tropics (averaging from 15°S-15°N) from MLS and TES measurements shown as color filled contours overlaid by GEOS CCM simulated (black contours) ozone sensitivity to ENSO.
Right: Ozone sensitivity (%/K) to ENSO over the eastern and central Pacific (averaging from 180°W-110°W). The dashed black curve is the simulated tropopause.
Technical Description of Figures:
The ozone sensitivity to ENSO is derived using deseasonalized MLS and TES monthly ozone measurements. Multiple linear regression is used with three predictor variables, the Niño 3.4 Index, and the first 2 empirical orthogonal functions of the Quasi-biennial Oscillation (QBO). The resulting regression coefficient (ozone sensitivity) for the Niño 3.4 Index is shown as the color filled contours (only for values significant above 1 standard deviation). This particular version of GEOS CCM does not simulate the QBO so a linear regression was done against the Niño 3.4 Index using deseasonalized ozone from a 25 year simulation forced with observed sea surface temperatures. The regression coefficient from the simulation is overlaid as black contours. The left panel shows the ozone sensitivity (%/K) to ENSO over the tropics (averaging from 15°S-15°N) and the right panel shows the ozone sensitivity (%/K) to ENSO over the eastern and central Pacific (averaging from 180°W-110°W). Changes as large as -20%/K are found over the tropical Pacific near the tropopause and increases of 4 to 8%/K are seen in the midlatitude Pacific near the tropopause and throughout much of the troposphere over Indonesia and the Indian Ocean. MLS measurements are taken from level 2 version 3.3 from Aug. 2004 - Mar. 2012 and TES measurements are from the level 3 version 2 product from Sept. 2004 - Dec. 2009. The typical range of the Niño 3.4 Index is about 3 K from a moderate La Niña to a moderate El Niño.
Scientific significance:
The El Niño Southern Oscillation (ENSO) is the dominant mode of tropical variability on interannual timescales. It is well known to have significant influence on the Walker Circulation in the tropical Pacific. Large perturbations to the circulation as well as resulting changes in water vapor can change ozone concentrations in the lower atmosphere. The largest changes in ozone from ENSO are seen near the tropopause which is a particularly sensitive region of our climate system. Ozone is an important greenhouse gas and changes in its amount especially in the upper troposphere influence radiative forcing at the surface. Ozone is also an important source of the hydroxyl radical (OH) which can impact the oxidizing capacity of the troposphere and the lifetimes of some greenhouse gases. Observations of the ozone sensitivity could provide a useful way to evaluate the representation of processes such as ENSO in chemistry-climate models. .
Relevance for future science and relationship to Decadal Survey:
A continuation of the ozone profile record from NASA's Aura satellite using instruments like MLS and TES will help to continue to refine the derived ozone sensitivity and help to separate its signal from other known processes impacting ozone. Future missions like the proposed Tier 3 Global Atmospheric Composition Mission (GACM) which will measure the vertical profile of ozone distribution especially in the upper troposphere and lower stratosphere will be very important in examining the vertical structure of these changes especially in regions showing large gradients in ozone sensitivity.
Data Sources:
Aura Microwave Limb Sounder (MLS) and Tropospheric Emission Spectrometer (TES).
References:
Oman, L.D, J.R. Ziemke, A.R. Douglass, D.W. Waugh, C. Lang, J.M. Rodriguez, and J.E. Nielsen (2011), The Response of Tropical Tropospheric Ozone to ENSO. Geophys. Res. Lett., 38, doi:10.1029/2011GL047865.
Oman, L.D, A.R. Douglass, J.R. Ziemke, J.M. Rodriguez, D.W. Waugh, and J.E. Nielsen (2012), The Ozone Response to ENSO in Aura Satellite Measurements and a Chemistry-Climate Simulation. J. Geophys. Res., Submitted.
Luke Oman, Anne Douglass, Jerry Ziemke, and Jose Rodriguez, Code 614, NASA GSFC
11.08.2012

