In March 2011, MLS measured unusually high Nitrous oxide (N2O) in the southern hemisphere middle stratosphere. The high N2O air, originating in the tropics, has low inorganic chlorine (Cly).
The high Nitrous oxide (N2O) /low inorganic chlorine (Cly) air was trapped inside the vortex as it formed in March. The low Cly air descended, arriving in the lower stratosphere by late winter, producing less chlorine monoxide (ClO) than usual.
(not shown) revealed that lower Cly led to less Ozone loss in 2011. The simulations also showed that less Ozone (O3) was transported to the Antarctic that winter. Less loss combined with less Ozone transport made the 2011 O3 hole look similar to 2006, a year with much higher chlorine.
These results show that variations in transport have a large impact on Antarctic lower stratospheric Cly and Ozone loss. Efforts to attribute Antarctic ozone hole recovery to declining stratospheric chlorine must account for the effects of transport variations on Antarctic chemistry.
Simulations with the Global Modeling Initiative (GMI) chemistry and transport model were run for both years, with and without heterogeneous chemical reactions from May-December of each year. The simulations without heterogeneous chemistry showed that much less O3 was transported to the Antarctic vortex in 2011 than 2006. By differencing the GMI simulations with and without het. chemistry we calculated that vortex O3 loss was significantly lower in 2011 than in 2006. The differences in transport and chemical loss contributions to Antarctic column O3 in October cannot be distinguished from the MLS O3 observations alone. A model is needed to quantify the contributions. However, MLS measurements of N2O and HCl confirm the transport differences calculated by the model and support the explanation.
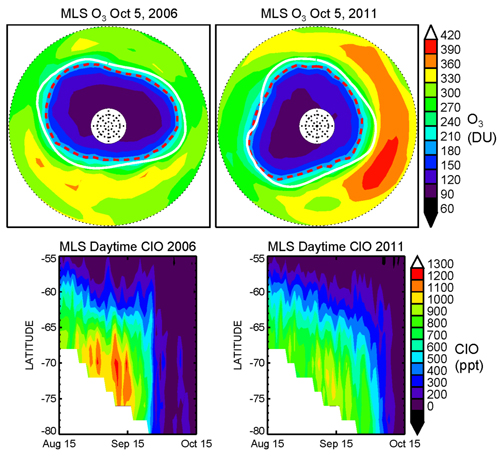
(Above) Figure 1 upper panels show MLS stratospheric column O3 (DU) for October 5 in 2006 and 2011. This date is chosen because the area of the hole is near the maximum and the column amount is near its minimum for both years. MLS daytime-averaged ClO (chlorine oxide) is large in the sunlit 'collar' region of the Antarctic vortex. Its peak values are about 20% lower in 2011 than 2006. Estimated equivalent stratospheric chlorine (EESC) is expected to decline during this period but by only a few percent. Changes in EESC are insufficient to explain the lower ClO in 2011.
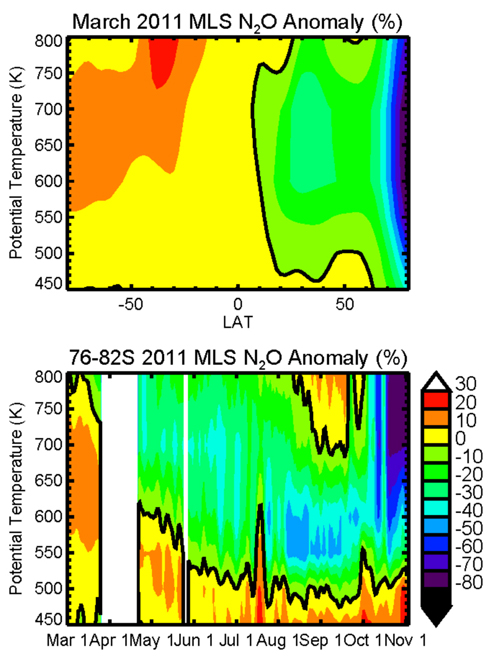
(Above) Figure 2 illustrates how the unusual composition of the 2011 Antarctic vortex came about. The middle stratospheric vortex forms in the March/April period. In 2011 the southern hemisphere middle stratosphere was unusually high in N2O-this implies greater than usual impact of tropical air on the midlatitudes. Tropical air has a lower mean age than midlatitude air, and high N2O is strongly anti-correlated with low Cly. Thus, the 2011 Antarctic vortex had unusually low Cly in the 600-750K range when it formed and descended to the 400-500K levels by late winter. Lower Cly results in less ClO.
Strahan et al. (2013), Geophys. Res. Lett., submitted.
11.04.2013

