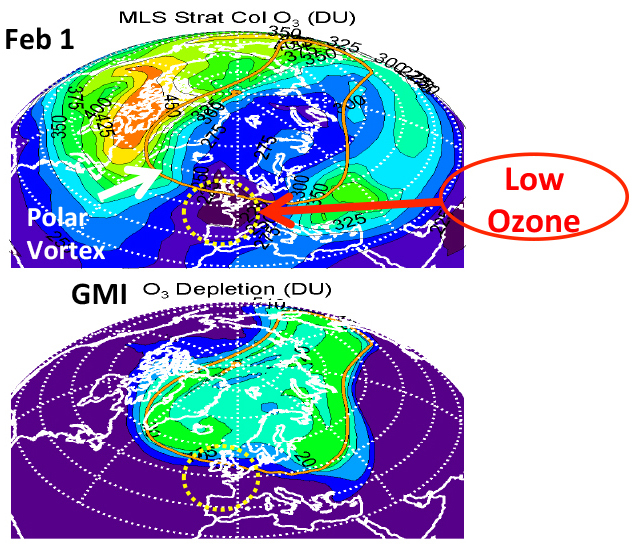
The left graphics show MLS northern hemisphere stratospheric column ozone on Feb. 1, 2016. Very low columns are seen over the UK and Europe ( < 225 DU, inside dashed circle). The lower graphic shows the GMI-calculated ozone depletion. It's very small, suggesting the low ozone does not indicate significant depletion.
The right graphics show how the high tropopause height in this region explains the observed low ozone. The lower panel shows that the high tropopause on Feb. 1 lifts the ozone profile compared to a typical profile found earlier in winter. This motion lifts the profile to lower pressures thus reducing the total column. The GMI Model shows only 4 Dobson Units (DU) of ozone depletion even though the column is more than 100 DU lower than one month earlier.
The GMI model calculated 4 Dobson Units (DU) of ozone depletion. The high tropopause, shown by MERRA, lifted the ozone profile to lower pressures, causing the stratospheric column to decrease by more than 100 DU compared to earlier in winter.
Data Sources: NASA Aura Microwave Limb Sounder (MLS) (ozone profiles and columns), NASA Global Modeling Initiative (GMI) Chemistry and Transport Model (calculated fozone depletion), and MERRA Tropopause Heights.
Susan Strahan, Paul Newman, Steve Steenrod, Code 614, NASA GSFC

