Quantifying descent in the stratospheric polar vortex is critical to understanding dynamical and composition changes, but vertical motion can rarely be measured directly. Trace gas measurements are often used to estimate vertical motion, but the accuracy of such estimates has not been assessed.
Carbon monoxide (CO) profile measurements from Aura MLS and ground-based observations are used, along with a climate model, to assess how processes other than vertical motion may affect vertical motion estimates. Processes such as chemistry and horizontal mixing are found to cause significant underestimates in descent.
Detailed understanding of the transport of trace gases is critical to validating and improving climate models, and to quantifying trace gas distributions and their radiative effects as the climate changes.
Technical Description of Figure:
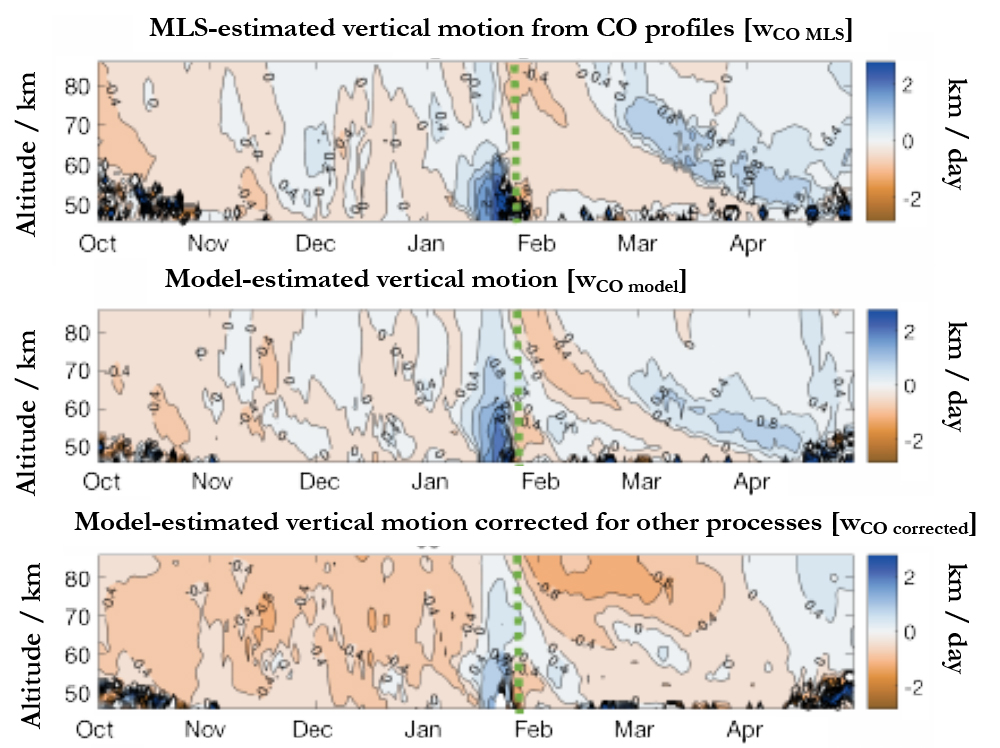
Polar vertical motion (warm colors indicated descent) calculated from MLS carbon monoxide and a climate model show good agreement (top, center panels). Modeled descent estimates are stronger when corrected for other causes of carbon monoxide changes (bottom panel) such as chemistry and horizontal mixing.
Rates of vertical motion (km day-1) during the 2008/2009 winter averaged over 60 to 90N latitude, calculated by tracking carbon monoxide (CO) abundances (i.e., volume mixing ratios) over time. WCO MLS is calculated from MLS data (top row) and WCO model is calculated using daily averaged modeled (SD-WACCM) CO profiles (center row); the MLS and modeled values agree well. WCO_corrected is corrected by accounting for changes from other causes (e.g., chemistry or horizontal mixing). WCO_corrected shows larger descent rates than WCO, indicating that other processes act to mask descent. The vertical green dashed line shows the start date of a major sudden stratospheric warming, after which enhanced descent can be seen., especially when the effects of other processes are accounted for.
Data Sources: The KIMRA CO data set (between December 2008 and May 2015) can be accessed publicly through PANGAEA Data Publisher for Earth and Environmental Science at https://doi.org/10.1594/PANGAEA.861730 (Ryan et al., 2017b). Model results shown in this paper are available on request via Doug Kinnison (dkin@ucar.edu). The Aura MLS v4.2 data are available from the Goddard Earth Sciences Data and Information Center at https://disc.gsfc.nasa.gov.
References: Ryan, N. J., Kinnison, D. E., Garcia, R. R., Hoffmann, C. G., Palm, M., Raffalski, U., and Notholt, J.: Assessing the ability to derive rates of polar middle-atmospheric descent using trace gas measurements from remote sensors, Atmos. Chem. Phys., 18, 1457-1474, https://doi.org/10.5194/acp-18-1457-2018, 2018.
5.29.2018

