The validation results reveal the bias of the spatial distribution of bottom-up NOx emissions inventories and for the first time point out that such bias can be reduced significantly by applying the spatial distribution of NOx emissions in the OMI-based inventory as the spatial proxy for the bottom-up inventory. This is expected to be generally true for regions all over the world including the US. The accuracy of the OMI-based inventory, DECSO, will substantially be improved over the US with the addition of upcoming geostationary missions, such as NASA's TEMPO instrument, where hourly NO2 observations provide important diurnal information.
Technical Description of Figure:
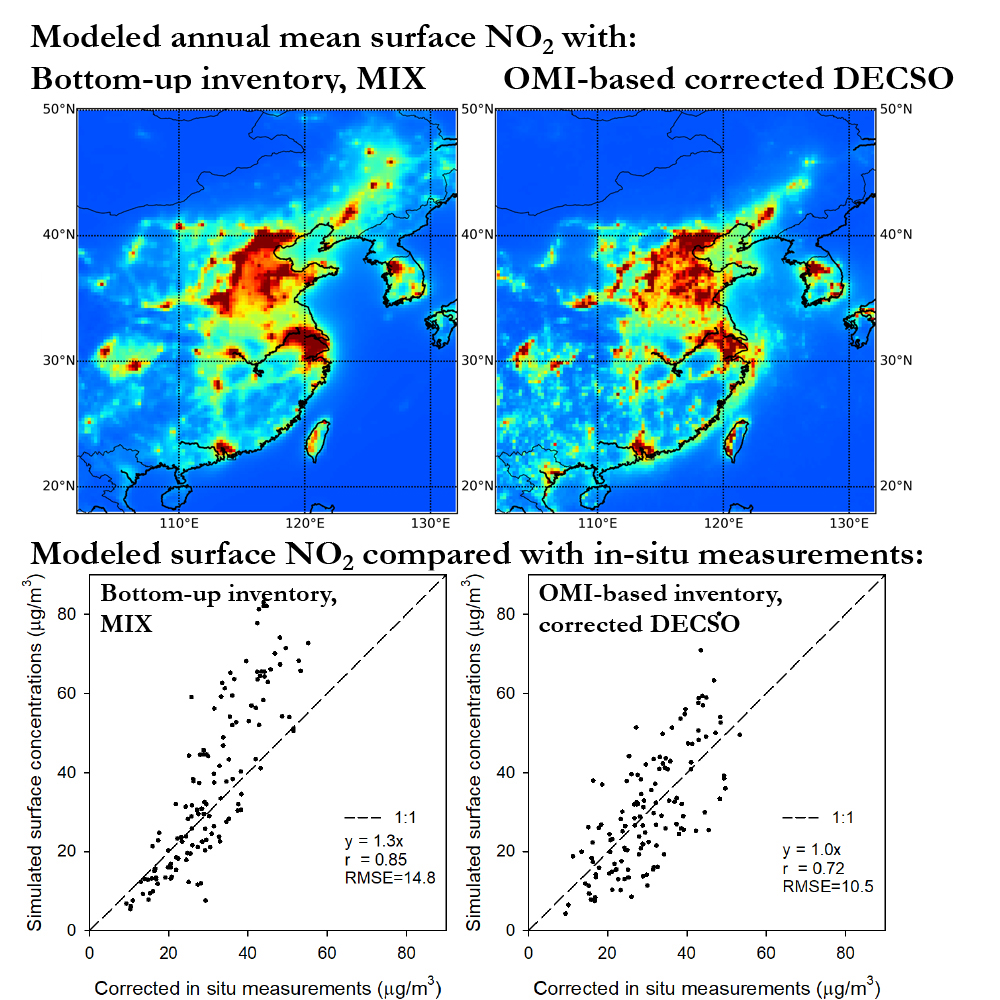
(Top) Annual mean surface NO2 concentration in 2015 based on the CHIMERE model driven by the MIX Asian inventory (a) and the corrected DECSO inventory (b). The corrected DECSO inventory is scaled emissions over China based on the bottom-up inventory MIX, but with the same DECSO spatial distribution. (Bottom) Scatter plots of the simulated annual mean surface NO2 concentrations in 2015 by the MIX Asian inventory (a) and the corrected DECSO inventory (b) and the corrected in situ measurements.
Data Sources: We use the CHIMERE model v2013b over East Asia (18 to 50° N and 102 to 132° E) with a resolution of 0.25°, driven by operational meteorological data from the European Centre for Medium- Range Weather Forecasts (ECMWF) with a horizontal resolution of 0.25°. The satellite-derived NOx emissions were estimated by the algorithm DECSO (Daily Emission estimates Constrained by Satellite Observations) v5 using an extended Kalman filter. Daily OMI NO2 observations retrieved with the DOMINO version 2 algorithm are used as a constraint to update emissions. The DECSO emission data are available at http://www.globemission.eu. Real-time hourly NO2 concentrations, recorded by the Ministry of Environmental Protection (MEP) in China and publicly accessible from the year 2013 onwards, were obtained from a total of 1413 air quality monitoring sites of the MEP network for 323 major cities over the model domain.
The bottom-up anthropogenic NOx emissions were taken from the MIX inventory, a mosaic Asian anthropogenic emission inventory under the international col- laboration framework of the Model Inter-Comparison Study for Asia (MICS-Asia) and the Task Force on Hemispheric Transport of Air Pollution (TF HTAP). The MIX inventory is developed for the years 2008 and 2010 by an integration of state-of-the-art regional emission inventories for all major anthropogenic sources in 29 countries and regions over Asia. The emissions of China integrated in the MIX inventory are derived from the Multi-resolution Emission Inventory for China (MEIC: http://www.meicmodel.org) compiled by Tsinghua University. The anthropogenic emissions with the biogenic emissions, which were computed automatically in the CHIMERE model using the global MEGAN (Model of Emissions of Gases and Aerosols from Nature) model, were adopted as the bottom-up inventory. Note that monthly emissions for all inventories above were provided at the spatial resolution of 0.25° x 0.25° .
References: Liu, F., van der A, R. J., Eskes, H., Ding, J., and Mijling, B.: Evaluation of modeling NO2 concentrations driven by satellite-derived and bottom-up emission inventories using in situ measurements over China, Atmos. Chem. Phys., 18, 4171-4186, https://doi.org/10.5194/acp-18-4171-2018, 2018.
5.29.2018

