This work evaluates the depiction of global upper atmospheric composition by two runs of the Whole Atmosphere Chemistry Climate Model (WACCM) for recent decades. The free-running (FR) and specified-dynamics (SD, “nudged”) model runs differ in their dynamical constraints (winds, temperatures). Biases, fits, and interannual variability for five species (O3, H2O, N2O, HCl, and HNO3) were computed by comparison to the Microwave Limb Sounder (MLS) time series (2005–2018) and a longer-term multi-sensor record (GOZCARDS).
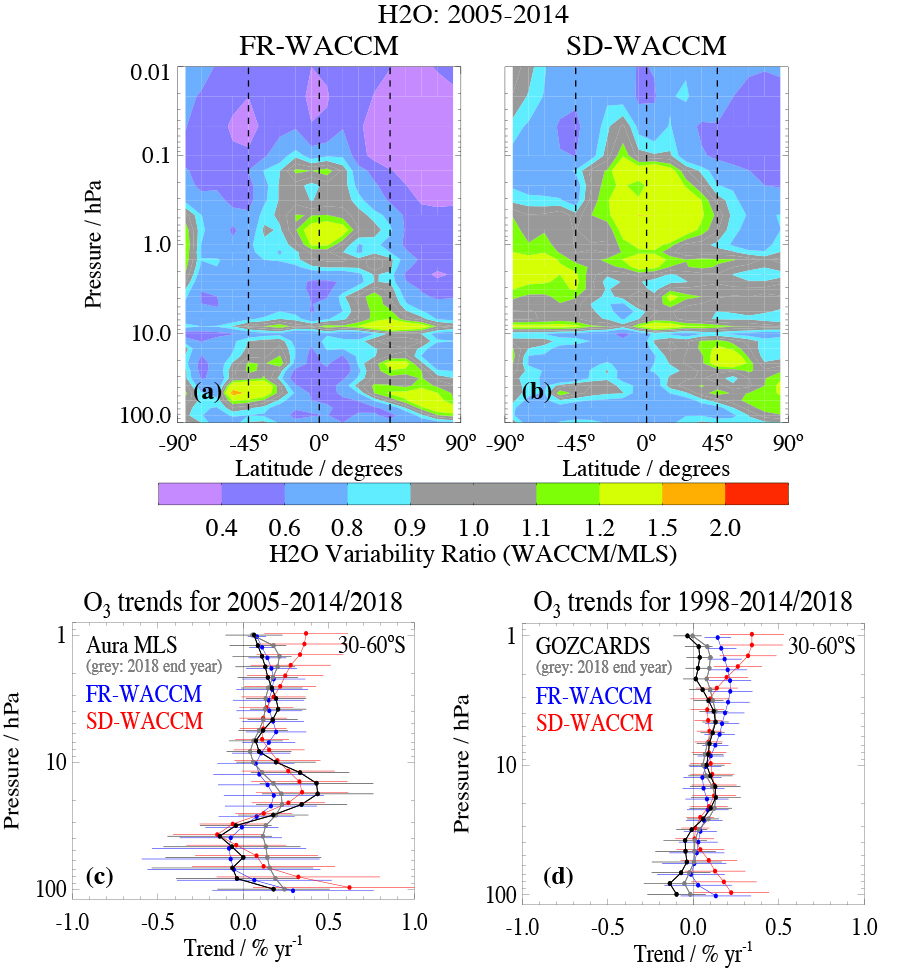
While the overall model/data match is impressive, a few discrepancies were noted. For example, FR-WACCM generally underestimates the observed H2O variability (Figures a & b). Both models and measurements show an increasing O3 trend in the southern midlatitudes from 2005 to 2018 (Figure c). These result in an overall positive ozone trend over the longer 1998–2018 period (Figure d). However, trends for ozone and other species show significant sensitivity to the time period considered, and to variability in the stratospheric Quasi-Biennial Oscillation.
(FR-WACCM and SD-WACCM) and observational time series show many areas of agreement, with some disagreements. (a), (b) H2O interannual variability ratios (model/data) (c), (d) Ozone trend profiles: comparisons for 30-60ᵒS
Technical Description of Figure:
The Figure is adapted from several Figures in the article. (a) and (b) show interannual variability ratios (model divided by data) for stratospheric and mesospheric water vapor, for FR-WACCM and SD-WACCM (respectively) versus MLS. Before calculating the ratios, variability values are obtained as the root mean square of detrended deseasonalized monthly anomaly series, expressed as a percentage of climatological abundances (2005 through 2014). (c) shows a model vs MLS ozone trend comparison for 30-60ᵒS and 2005 through 2014. Trends are obtained from multiple linear regression analyses of deseasonalized anomaly time series; error bars are 2-sigma estimates based on bootstrap resampling results. MLS trends are in black (and in grey for 2005-2018); FR-WACCM & SD-WACCM trends are in blue and red, respectively. (d) is similar to (c) but for a comparison to GOZCARDS merged ozone data over a longer time period (with 1998 as start year).
Scientific significance, societal relevance, and relationships to future missions:
Detailed model/data comparisons such as these are useful for assessing, and refining, current global atmospheric models. This also has implications for uncertainties in model estimates of future change. Indeed, an underestimate of water vapor variability in the FR-WACCM run implies that the trends predicted by this model for future years would carry smaller error bars than implied by the observed variability. At present, there are very few confirmed plans for future satellite missions (especially NASA-led) with a focus on high quality global vertically-resolved multi-species composition measurements from the upper troposphere to the upper stratosphere. - This research was carried out as part of a NASA award (ROSES ACMAP12-0030).
Data Sources:
Microwave Limb Sounder (MLS) data sets feature prominently in these analyses. Zonal means are calculated from MLS Level 2 data files, publicly available from https://disc.gsfc.nasa.gov/datasets?keywords=MLS&page=1. GOZCARDS (Global OZone Chemistry And Related trace gas Data records for the Stratosphere) is a merged satellite data set used in this study. GOZCARDS monthly zonal mean data files can be found at the following location: https://disc.gsfc.nasa.gov/datasets?keywords=GOZCARDS&page=1. The WACCM model output is available from the NCAR Earth System Grid at https://www.earthsystemgrid.org/search.html?Project=CCMI1.
References: Froidevaux, L., Kinnison, D. E., Wang, R., Anderson, J., and Fuller, R.: Evaluation of CESM1 (WACCM) free-running and specified dynamics atmospheric composition simulations using global multispecies satellite data records, Atmos. Chem. Phys., 19, 4783–4821, 2019; https://www.atmos-chem-phys.net/19/4783/2019/..
6.2019

