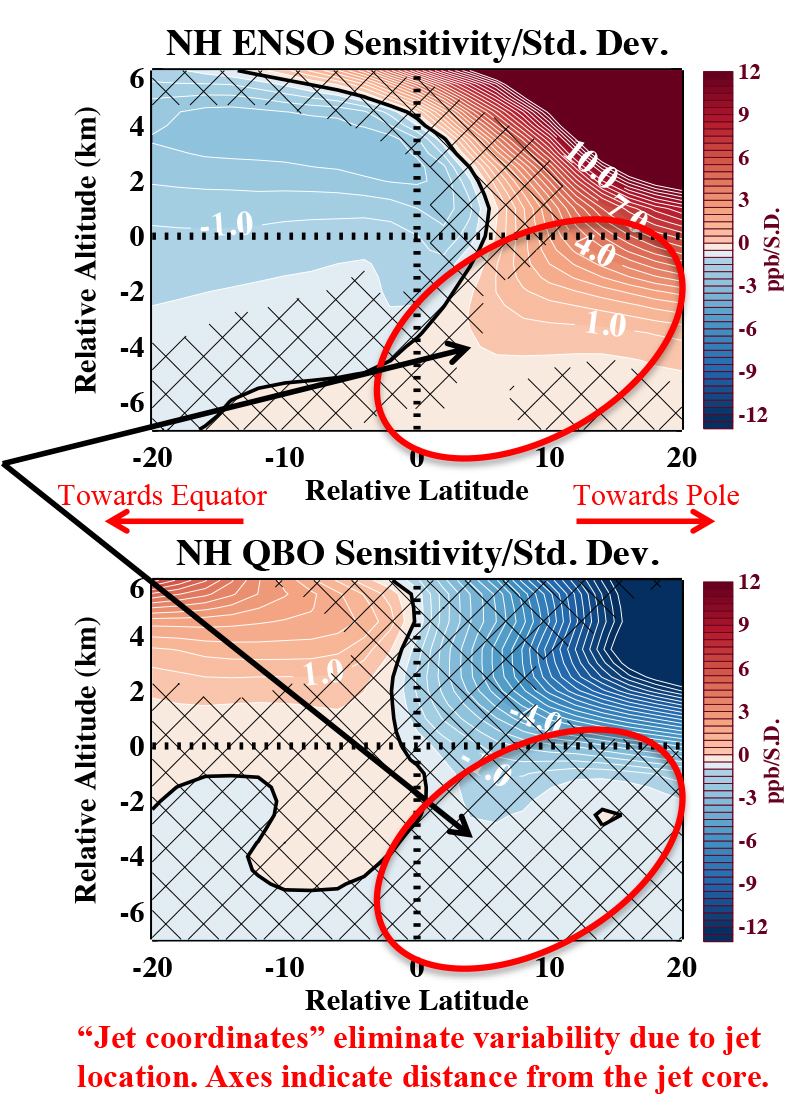
 Northern hemispheric (NH) mean ozone sensitivity (ppb/standard deviation) to ENSO (top) and QBO (bottom) relative to the northern hemispheric subtropical jet. Red colors indicate ozone increases during El Niño or QBO westerlies. Crosshatching: not statistically significant.
Natural sources of variability include the Quasi-biennial Oscillation (QBO), a semi-regular oscillation of easterly and westerly winds in the tropical stratosphere, and the El Niño-Southern Oscillation (ENSO), an irregular oscillation of tropical Pacific sea surface temperatures. They are thought to influence the frequency and/or strength of intrusions of stratospheric air deep into the troposphere (i.e., stratospheric intrusions).
This study uses regression analysis with NASA Aura Ozone Monitoring Instrument (OMI) and Microwave Limb Sounder (MLS) ozone assimilated into the NASA GMAO GEOS model to determine the sensitivity of ozone around the subtropical jets to both the QBO and ENSO. “Jet coordinates”, or coordinates relative to the location of the subtropical jets, are used to account for fluctuations in jet location.
Technical Description of Figure:
The hemispheric mean ozone sensitivity to the Niño 3.4 index relative to the subtropical jet over 2005-2013 in the NH is shown in the upper panel. Bottom panel show the ozone sensitivity to the QBO index in the NH. In both cases, the sensitivity is shown as the change in ozone (ppbv) per 1 standard deviation of that index. This allows for a more direct comparison of the influence of ENSO and QBO. Red colors represent positive sensitivity, while blue colors represent negative sensitivity. Contour intervals are 0.5 ppb/s.d.. Crosshatched regions denote where the sensitivity is not statistically different from zero at the 95% confidence level. Note that the extension of the contours towards the equator below the jet indicates an influence on the ozone in tropopause folds and stratosphere to troposphere transport.
Scientific significance, societal relevance, and relationships to future missions:
Quantifying the natural sources of ozone variability in the troposphere and lower stratosphere (UTLS) is important for assessing and evaluating anthropogenic impacts on this important trace gas. The QBO and ENSO are two of the most important modes of natural variability that affect the transport of chemical species in the stratosphere and troposphere. Thus, understanding the impact of these two forcings aids in determining current anthropogenic influence, as well as evaluating simulated projections. These results can be used to assess model representation of QBO and ENSO influence on ozone from a dynamical perspective in a way that removes the first-order impact due to differences in the location of the subtropical jets.
Both the global and regional influence of ENSO and QBO varies in magnitude and sign depending upon the location relative to the subtropical jet. These differences in the response can generally divided into quadrants based upon the jet location.
The midlatitude stratospheric responses to ENSO and QBO are similar in magnitude and thus the net response can greatly cancel or strongly reinforce depending upon their relative phases. This emphasizes the need to consider both ENSO and QBO together in assessments of the natural variability of lower stratospheric middle latitude ozone
Data Sources:
Ozone Monitoring Instrument (OMI) and Microwave Limb Sounder (MLS) ozone observations are assimilated into the Goddard Earth Observing System Data Assimilation System (GEOS DAS) along with other meteorological data for the years 2005-2013. Only the OMI and MLS data directly modify the analysis ozone field. The location of the subtropical jets are determined following the algorithm by Manney et al. (Atmos. Chem. Phys., 11(12), 2011). The ozone fields are then mapped to coordinates relative to the vertical and horizontal distance from the subtropical jet in each hemisphere. These coordinates eliminate the apparent variability due to the varying location of the STJ. The GEOS DAS analyses used in this study are available free to the public at the Aura Validation Data Center website, https://avdc.gsfc.nasa.gov.
Multiple linear regression analysis is used to determine the sensitivity of the ozone to ENSO and QBO. The monthly mean Niño 3.4 index from the NOAA Climate Prediction Center (CPC) (http://www.cpc.ncep.noaa.gov/data/indices/) is used to characterize the variation of ENSO. The QBO variation is characterized by the CPC monthly mean equatorial 50 hPa zonal wind index and is also available at the same NOAA CPC website.
References: Olsen, M. A., Manney, G. L., & Liu, J. ( 2019). The ENSO and QBO impact on ozone variability and stratosphere‐troposphere exchange relative to the subtropical jets. Journal of Geophysical Research: Atmospheres, 124. https://doi.org/10.1029/2019JD030435.
7.2019