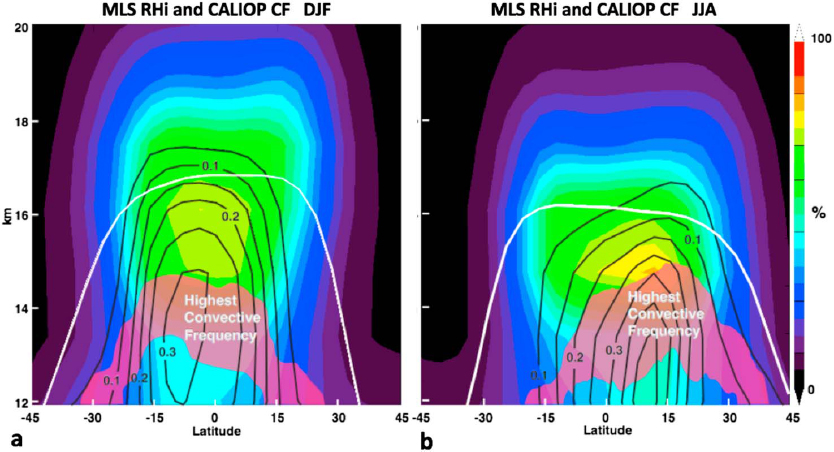
A recent study used relative humidity (RHi) and cloud fraction (CF) observations from NASA’s Microwave Limb Sounder (MLS) and Cloud-Aerosol Lidar with Orthogonal Polarization (CALIOP) instruments, in conjunction with observations from NASA and other field experiments and 1D and Lagrangian models.
The study shows that the high humidity is due to both horizontal transport of air into colder regions, and slow ascent due to radiative heating, both of which lead to cloud formation. In contrast with some previous studies, the study also found that convection is not important in maintaining this high humidity environment.
The radiative impacts of water vapor, the strongest greenhouse gas, are greatest at these altitudes. Better understanding of the processes controlling the humidity of this region is essential for understanding its role in climate feedbacks and for improving climate projections.

MLS RHi (colors) and CALIOP CF (black contours). During DJF (December–February), the peak in RHi (about 16 km) is located well above both the highest convective frequency and the peak in CF. This suggests that convective moistening has a direct impact only in the lower part of the Tropical Tropopause Layer (TTL) and is less important at higher altitudes. During JJA (June–August), in contrast, the peak in RHi and peak convective frequency have a closer correspondence.
Technical description of figure:
Zonal mean RHi (color). Black contours indicate the zonal mean CALIOP cloud fraction, and the red band shows the zone of the highest density of satellite convective tops; thick white line is the zonal mean tropopause. (a) DJF. (b) JJA. CALIOP = Cloud‐Aerosol Lidar with Orthogonal Polarization; CF = cloud fraction; MLS = Microwave Limb Sounder; RHi = relative humidity with respect to ice; DJF = December–February; JJA = June–August. See front page caption for interpretation.
Scientific significance, societal relevance, and relationships to future missions:
In addition to affecting the radiative balance of the TTL itself (see front page), the processes investigated here strongly control the humidity of air entering the stratosphere. This work accordingly provides additional insights into the future evolution of stratospheric water vapor, a parameter whose variability may account for as much as 30% of equilibrium climate sensitivity.
No future missions are currently planned to provide water vapor observations with the same daily near-global-coverage as Aura MLS. The European Altius mission will provide sparser (~monthly global coverage) water vapor observations using solar occultation. The Decadal Survey “Aerosols, Clouds, Convection, and Precipitation” (ACCP) designated observables will likely include measurements similar to those from CALIOP.
Data sources:
CALIOP, MLS, and MERRA2 data used in this study are publicly available from NASA. Satellite convection data sets are available through Lenny Pfister and/or Rei Ueyama (Leonhard.Pfister@nasa.gov, Rei.Ueyama@nasa.gov). Aircraft data are available from the NASA Earth Science Project Office. Ticosonde water vapor soundings are archived with the Network for Detection of Atmospheric Composition Change (NDACC).
References: Schoeberl, M. R., Jensen, E. J., Pfister, L., Ueyama, R., Wang, T., Selkirk, H., et al. (2019). Water vapor, clouds, and saturation in the tropical tropopause layer. Journal of Geophysical Research: Atmospheres, 124, 3984–4003. doi:10.1029/2018JD029849
9.2019